
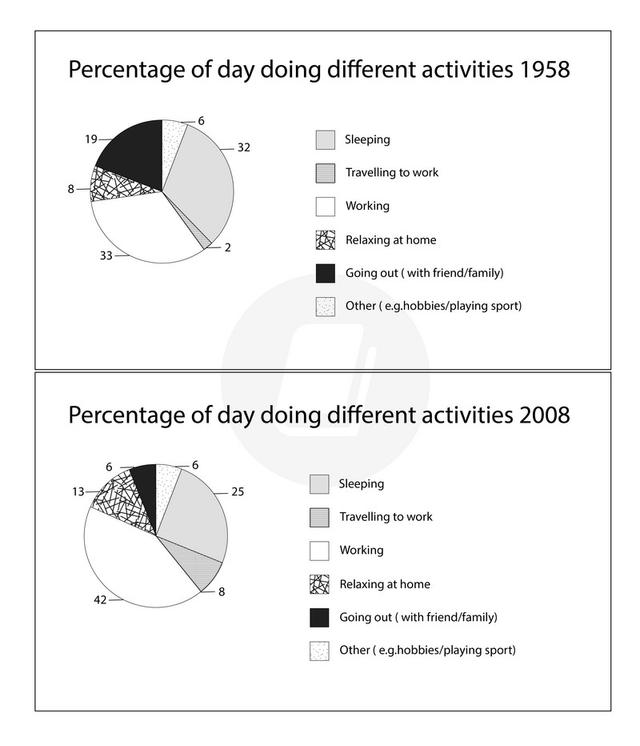
Given pie chart compares the percentage of allocating
time
to different activities by adults in a given country between 1958 and 2008 years.
It is clear from the graph that the dominant parts of both graphs were sleeping and working Use synonyms
whereas
travelling to work and other activities as similar as hobbies, playing and sport were the Linking Words
least
ones.
Correct your spelling
last
According to
1958, working and sleeping were nearly the most interesting amusements for that moment Linking Words
then
sleep mode dropped from 32% to a quarter for the period, Linking Words
while
employing increased from 33% to 42%, making it the most popular.
Another general tendency is that, in comparison to 1958, teenagers decreasingly spend Linking Words
time
at home. Use synonyms
In particular
, 2008 witnessed a slight growth in the relaxing Linking Words
at home
section from 8% to 13%, respectively. The amount of young learners who hung out with their friends declined to 6% in 2008. Meanwhile, the rate of Add a hyphen
at-home
time
spent on other activities was identical to Use synonyms
time
spent on travel to work, at 8%Use synonyms