
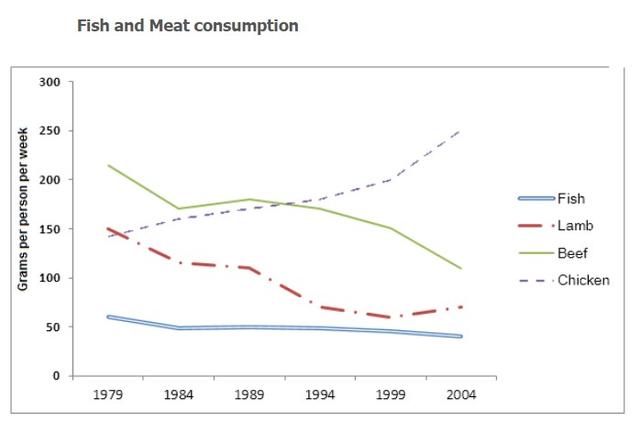
The line graph presents how much fish, lamb, beef, and
chicken
were consumed by people living in European countries from 1979 to 2004. It was measured in Use synonyms
grams
per person per Use synonyms
week
.
Use synonyms
Overall
, people eating seafood remained steady throughout the years. Linking Words
Whereas
, the consumption of meat decreased over the years Linking Words
while
Linking Words
chicken
consumption gradually increased during that period.
Both beef and lamb consumption decreased by about 100 Use synonyms
grams
per Use synonyms
week
between 1979 and 1984. After that year, the amount of meat being consumed slightly fluctuated and decreased by half in 2004.
In 1979, each person in Europe consumed almost 150 Use synonyms
grams
of Use synonyms
chicken
on average per Use synonyms
week
. After that, the trend of eating Use synonyms
chicken
substantially grew each year and it almost doubled by 2004. Use synonyms
On the other hand
, people in Europe didn't eat much fish when compared with meat and Linking Words
chicken
. The amount of fish being eaten is only around 50 Use synonyms
grams
per Use synonyms
week
for the whole 25 years.Use synonyms