
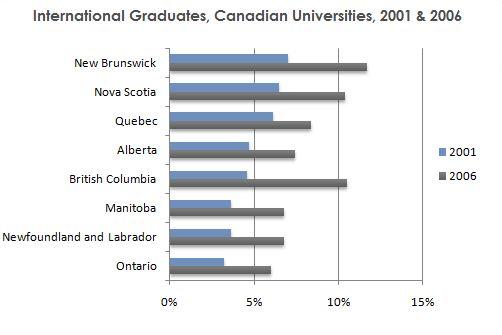
The bar graph illustrates the rate of international alumni in eight different provincial universities in Canada between 2001 and 2006. The figures are presented in percentages per area.
Overall
, there has been a sharp increase in Linking Words
a
number of of international degree holders in a five-year span.It is Correct article usage
the
also
clear that New Linking Words
Brunswick
has the highest product of scholars among provinces,Use synonyms
while
Ontario has the least.
Among all Canadian universities in 2001, New Linking Words
Brunswick
had the highest number of alumni which is around
8 %. Followed by Nova Scotia with over 7 %, Use synonyms
whereas
Ontario has the lowest product just 3 %. Linking Words
By comparison
, New Linking Words
Brunswick
had almost double the number of graduates.
A similar, pattern can be observed in the 2006 degree holder New Use synonyms
Brunswick
has the top rating with 12%. Next to it are Nova Scotia and British Columbia with over 10 %. Meanwhile, Ontario still possesses the lowest product of students with just over 5 % which is half of the alumni in New Use synonyms
Brunswick
.Use synonyms