
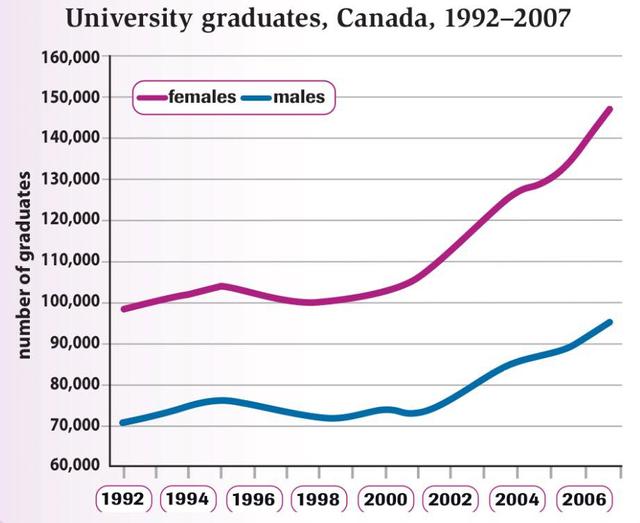
The line graph clarifies the proportion of men and women who they have completed their university studies in Canada between 1992_2007.
Overall
, the Linking Words
number
of graduates increased gradually over time, we notice from the table a huge amount of Use synonyms
students
finished their studies in 2006 compared to the minimum Use synonyms
number
of Use synonyms
students
in 1992.
Use synonyms
Firstly
, when we take a look at the table, we found in 1992 about 70000 male Linking Words
students
had completed their studies in academic and these figures dropped to 98000 in 2006 . Use synonyms
Whereas
, approximately 100000 female Linking Words
students
had graduated from Canadian universities in 1998 and these numbers picked up to 150000 in 2006. Use synonyms
However
, we notice from the chart a lot of girls received education Linking Words
in contrast
to boys. Linking Words
In addition
, more women were educated from 1998-2006 , Linking Words
although
a lot of men received an education in 2006 compared to 1998 but still the Linking Words
number
of females doubled the Use synonyms
number
of males in the field of study.Use synonyms