
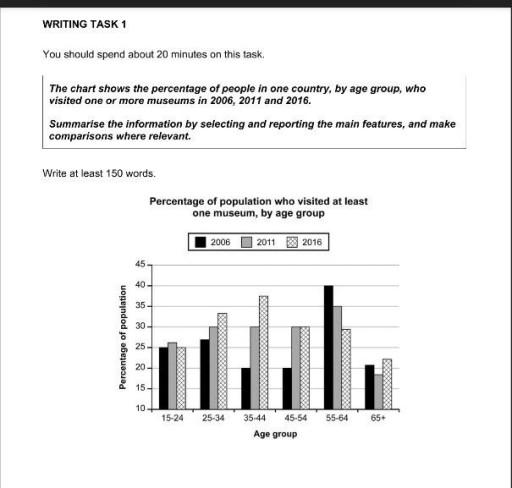
The bar chart compares the percentage of different age groups of people who visited at least one museum in three different
years
.
Use synonyms
Overall
, Linking Words
it is clear that
the percentage of the population who were 65 Linking Words
years
old or older has been less interested in visiting museums, Use synonyms
while
those between 55 and 64 Linking Words
years
old were more interested. Use synonyms
Also
, the most significant change is related to dwellers who are 35-44 Linking Words
years
old.
Looking at the youngest group (15-24 Use synonyms
years
old), there was no considerable change in three separate Use synonyms
years
. Use synonyms
However
, the figure for the two groups of 25-34 and 35-44 Linking Words
years
experienced a striking rise, especially for the latter group, making it in 2016 about two times as high as in 2006.
Regarding older groups, Use synonyms
although
the residents between 45 and 54 Linking Words
years
old were more interested in visiting the museums, the trend for those aged 55 to 64 decreased, reaching about one-third of the total number of visitors. Use synonyms
Finally
, those older than 65 Linking Words
years
were the least interested in going to the museums even for one time.Use synonyms