The graph below gives information from a 2008 report about consumption of energy in the USA since 1980 with projections until 200 Summarize the information by selecting and reporting main features, and make comparisons where relevant.

The graph below gives information from a 2008 report about consumption of energy in the USA since 1980 with projections until 200 

Summarize the information by selecting and reporting main features, and make comparisons where relevant.
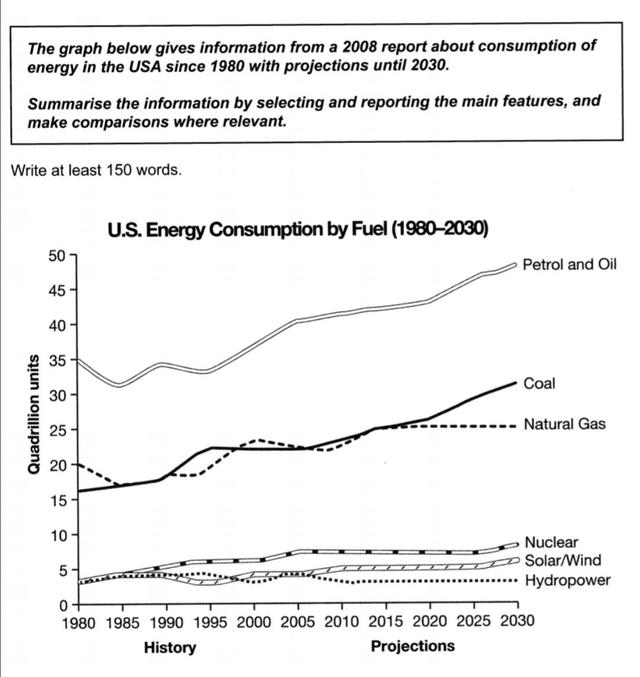
The line chart draws the conclusion from a survey about the consumption of some various power have been investigated by fuel in the United States of America since 1980 with a projection until 200. On the whole, the data provides information on the patrol and the oil appears to be clear a significant upward trend in the future and has been a large fraction.
However
, hydropower has been estimated as a period of stability and shows the lowest point in all years. In 1980 before starting some changes, petrol and oil had seemed to an important majurity of 35 quadrillion and the second highest on the natural gas was 20.
Also
, the third rank was coal and the other three fuels were the lowest and had the same portion. By looking at the next years, all types of energy predict a slight and marked increase from 1980 to 2030, except hydropower which will have not shifted. The next sharp amount in the coal will be over 30. After that around 35 of the natural gas fluctuation seems to be third rank in the future.
Nevertheless
, the nuclear ,the solar or wind and the hydropower hit the fewest points between two and 10 quadrillion.
Submitted by Hassanihn on

Unauthorized use and/or duplication of this material without express and written permission from this site’s author and/or owner is strictly prohibited. Excerpts and links may be used, provided that full and clear credit is given to Writing9 with appropriate and specific direction to the original content.

Introduction: The introduction is missing.
Introduction: Change the first sentence in the introduction.
Introduction: The chart intro is missing.
Topic Vocabulary:
  • depicts
  • trend
  • consumption
  • projections
  • slow growth
  • advancements
  • efficiency
  • acceleration
  • underscoring
  • expanding economy
  • household demands
  • trajectory
  • technological advancements
  • population growth
  • standards of living
  • renewable energy
  • fossil fuels
  • sustainable energy policies
  • environmental impacts
What to do next:
Look at other essays: