The table and charts below give information on the police budget for 2017 and 2018 in one area of Britain. The table shows where the money came from and the charts show how it was distributed. Summarise the information by selecting and reporting the main features, and make comparisons where relevant.

The table and charts below give information on the police budget for 2017 and 2018 in one area of Britain. The table shows where the money came from and the charts show how it was distributed.

Summarise the information by selecting and reporting the main features, and make comparisons where relevant.
The
two
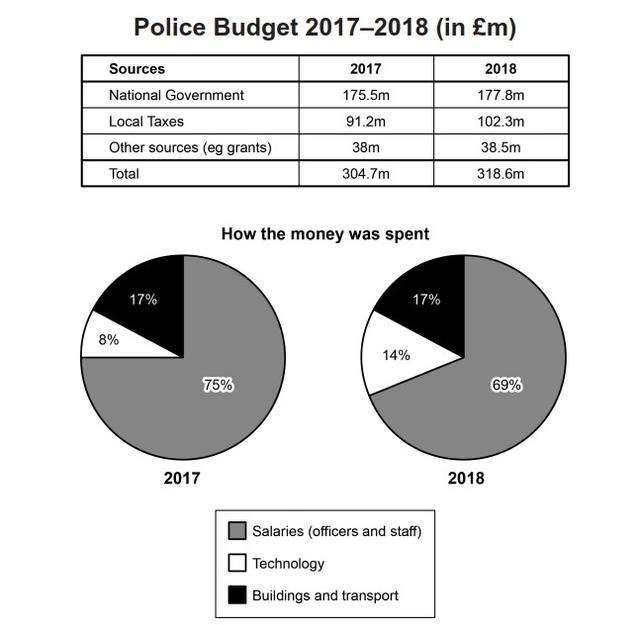
charts below compare the millions of pounds of police budget from different resources and the percentage of spending, in one area of Britain in 2017 and 2018.
Overall
, the
two
charts witnessed a slight change. The chart of income had a marginal rise, and there was more money spent on technology during the given years. To be specific, the money from the national government stood the highest in the budget, rising from 175.5 to 177.8 million in 2017 and 2018;
however
, police got money from local taxes, which experienced more improvement than other items, started at 91.2 million, and by 11.1 to 102.3 million in one year. Meanwhile, other sources only increased a few by 0.5, and the
two
year's
overall
deposits were similar.
On the other hand
, police salaries were the main expense, spending 75% and 69% of all, respectively, in 2017 and 2018.
Although
salary spending was reduced by 6% in 2018, technology gained more than in 2017. In comparison with salaries and technology, the expenditure spent on building and transport remained the same, being 17% in the figure in
two
years.
Submitted by Chloe on

Unauthorized use and/or duplication of this material without express and written permission from this site’s author and/or owner is strictly prohibited. Excerpts and links may be used, provided that full and clear credit is given to Writing9 with appropriate and specific direction to the original content.

Linking words: Don't use the same linking words: "overall".
Vocabulary: Rephrase your introduction. Words match: 67%.
Vocabulary: Replace the words two with synonyms.
Vocabulary: The word "charts" was used 3 times.
Topic Vocabulary:
  • Fiscal allocations
  • Revenue streams
  • Budgetary oversight
  • Expenditure
  • Financial appropriation
  • Government grants
  • Local taxation
  • Operational costs
  • Capital investment
  • Public safety
  • Crime prevention
  • Community policing
  • Resource allocation
  • Year-on-year comparison
  • Budgetary constraints
  • Fiscal year
  • Fund disbursement
  • Budget deficit/surplus
  • Trend analysis
  • Financial sustainability
  • Law enforcement funding
What to do next:
Look at other essays: