The graph below shows the number of tourists visiting a particular Caribbean island between 2010 and 2017. Summarise the information by selecting and reporting the main features,and make comparisons where relevant.

The graph below shows the number of tourists visiting a particular Caribbean island between 2010 and 2017.

Summarise the information by selecting and reporting the main features,and make comparisons where relevant.
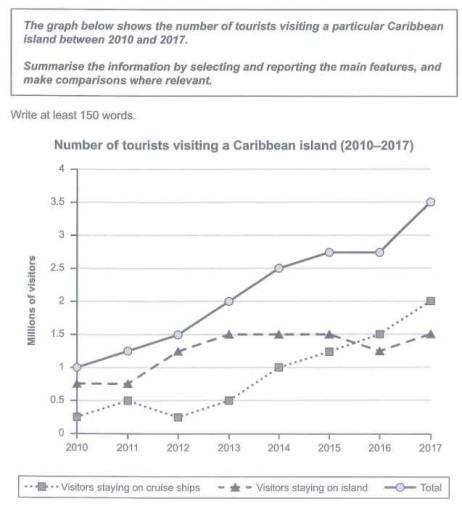
Illustrated in the diagram is information pertaining to how many tourists visited an island in the Caribbean from 2010 to 2017.
Overall
, the figures saw a considerable rise in the 2 categories and their total statistics. Another notable point for consideration is the number of visitors staying on the island, which remained rather constant since 2013. Looking at data for cruise ships' stay and the
overall
total in detail, it is evident that the former doubled from a low of 0.25m to 0.5m in the first year before declining to its initial number. In the following years, stats steadily went up and reached exactly 2m in the end. Concerning the total figure, starting at 1m in 2010, numbers climbed to 2.7m in 2015 before remaining unchanged in the next year. Followed by
this
is a jump up to 3.5m
at the end
of the given period. Turning to the remaining data, where the
overall
incline is less significant. Figures for the number of visitors inland remained at around 0.7m in the first year before gradually inclining to exactly 1.5m in 2013.
Following
this
trend, figures remained stable stable until the end of the timeframe, despite seeing a low of 1.2m in 2016.
Submitted by  11E4 Community on

Unauthorized use and/or duplication of this material without express and written permission from this site’s author and/or owner is strictly prohibited. Excerpts and links may be used, provided that full and clear credit is given to Writing9 with appropriate and specific direction to the original content.

Sentences: Add more complex sentences.
Linking words: Don't use the same linking words: "overall".
Introduction: The introduction is missing.
Introduction: The chart intro is missing.
Vocabulary: Replace the words m with synonyms.
Vocabulary: The word "figures" was used 4 times.
Vocabulary: The word "data" was used 2 times.
Vocabulary: The word "number of" was used 2 times.
Vocabulary: The word "remained" was used 3 times.
Vocabulary: The word "stable" was used 2 times.
Topic Vocabulary:
  • trend
  • fluctuation
  • peak
  • trough
  • gradual increase
  • sharp decline
  • steady growth
  • plateau
  • seasonal variation
  • external influences
  • tourist influx
  • sustainable tourism
  • economic impact
  • hospitality industry
  • travel restrictions
  • visitor statistics
What to do next:
Look at other essays: