
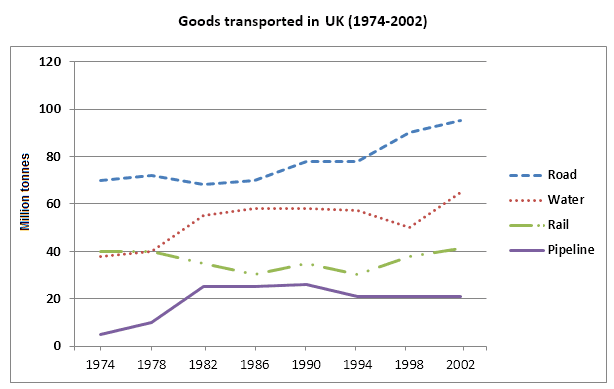
The line chart presents the quantities of
goods
transported in the United Kingdom from 1974 to 2002, using four different means of transportation including road, water, rail, and pipeline. Use synonyms
Overall
, throughout the whole time frame, the amount of Linking Words
goods
transported increased in all four given ways. Use synonyms
Moreover
, the proportion of Linking Words
goods
transported by road ranked Use synonyms
first,
Linking Words
while
that of pipeline stood Linking Words
last
in the amount allocated.
The largest quantity of Linking Words
goods
transported both in 1974 and 2002 was by road (70 Use synonyms
million
Use synonyms
tonnes
and 98 Use synonyms
million
Use synonyms
tonnes
, respectively), meanwhile, the lowest during that time was a pipeline (about a very small number of Use synonyms
million
Use synonyms
tonnes
and 22 Use synonyms
million
Use synonyms
tonnes
, respectively).
From 1974 to 1978, Use synonyms
while
water and rail transportation experienced a consistent trend, at around two-fifths Linking Words
million
Use synonyms
tonnes
, over the following 20 years, they followed an opposite pattern with the former increasing, ranging from 40 Use synonyms
million
Use synonyms
tonnes
and almost 62 Use synonyms
million
Use synonyms
tonnes
, the latter decreasing, starting the point at two fifth Use synonyms
million
Use synonyms
tonnes
, and finishing at its initiative value, respectively.Use synonyms