
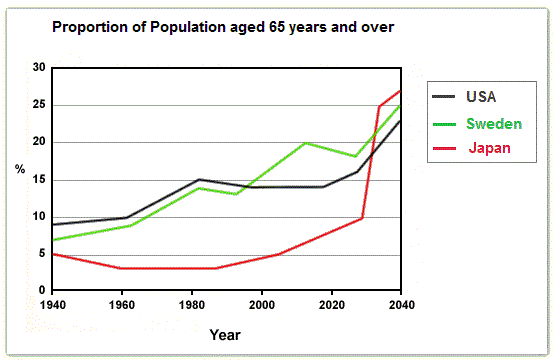
The graph illustrates the change in
proportion
of Add an article
the proportion
population
aged 65 years and above, Add an article
the population
specific
in Change the word
specifically
USA
, Correct article usage
the USA
Sweden
, and Japan, from 1940 to 2024 Use synonyms
along with
a projection in 2040. In general, all of the Linking Words
country
experienced an upward trend from 1940 to 2024 despite some fluctuations. Those are set to have the same trend as the previous in 2040 with Japan will surpass the other two countries.
Change to a plural noun
countries
Adult
population in Japan stood Add an article
The adult
as
Change preposition
at
the
lowest in 1940 at only 5%. It Change the word
its
then
hovered from 3 - 5% during 1940 to 2005. Linking Words
However
, the graph saw an increase after 2005 and will likely Linking Words
to
climb to 25% Fix the infinitive
apply
in
the end of the year presented.
Change the preposition
at
Otherwise
, Linking Words
USA
and Correct article usage
the USA
Sweden
started at 7,5% and 9% respectively, becoming the highest and second highest proportion of Use synonyms
adult
population. American people aged 65 years+ grew to 15% but suddenly it had a pitfall to below 15% in 2020. Add an article
the adult
Similary
, the same trend was found in Correct your spelling
Similarly
Sweden
's graph until 1980, Use synonyms
however
when a drop happened in 1990 at 13%, it Linking Words
then
Linking Words
bounched
back in 1990 and reached 20% in 2010. Eventually, Correct your spelling
bounced
USA
and Correct article usage
the USA
Sweden
are expected to rise to 22,5% and 25% consecutively.Use synonyms