
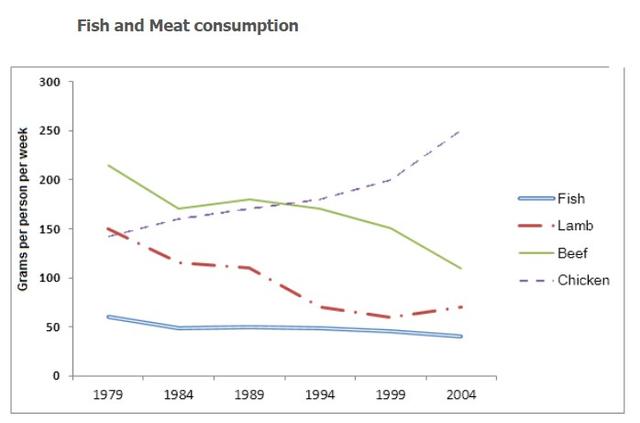
A glance at a picture depicts the change in fish and several
type
of meat (chicken, Change to a plural noun
types
beef
, and Use synonyms
lamp
) consumption specifically in the European country, ranging from 1979 to 2004. In summary, those protein sources Correct your spelling
lamb
had
been through some fluctuations. Wrong verb form
have
However
, the graph saw an upward trend for consumption of chicken, Linking Words
otherwise
Linking Words
beef
and lamb decreased gradually. Unlike the other goods, people who chose fish relatively remained stable.
In more detail, chicken started at below 150 Use synonyms
grams
per person per week. Use synonyms
Nevertheless
, it outreached lamb and Linking Words
beef
in 1980 and 1989 at 149 and above 200 respectively. The trend increased gradually to its peak at 250 Use synonyms
grams
.
Use synonyms
On the other hand
, Linking Words
beef
Use synonyms
,
stood Remove the comma
apply
firsly
at 220 Correct your spelling
first
grams
per individual in a week, fluctuated Use synonyms
during
1970 to 1984, with its lowest and highest at 175 and nearly 250 consecutively. After remaining stable at 240 in the following 5 years, it continued to fall more than 100% in 2004 at only 100. Change preposition
from
Likewise
, the utilization of lamb as Linking Words
protein
Correct article usage
a protein
sources
accounted for 150. Unfortunately, it Fix the agreement mistake
source
drop
significantly to nearly 50 despite the upward trend in 1987 and 1997 at 125 and 100 respectively.
Change the verb form
drops
Lastly
, fish amounted to only 60 Linking Words
grams
per person per week Use synonyms
at
the first year presented. It hovered at approximately 50% from 1984 to 1999, before going down to 40% in 2004.Change preposition
in