
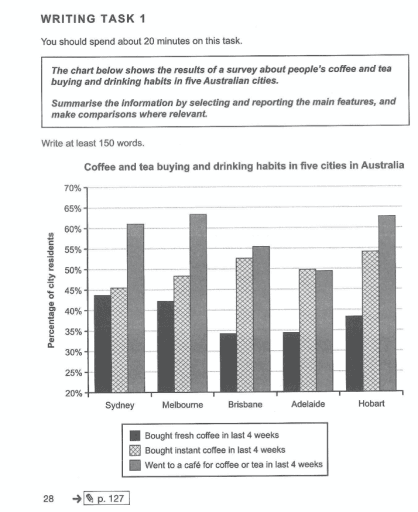
The bar chart illustrates the pattern of tea and
coffee
consumption by Australians in the five different Use synonyms
cities
of Use synonyms
this
country, in Linking Words
percentage
.
Use synonyms
Overall
, it is noticeable that most people went to Linking Words
coffee
shops to buy these drinks in the Use synonyms
last
four weeks in all the Linking Words
cities
, except the ones living in Adelaide who are mostly into buying Use synonyms
instant
Use synonyms
coffee
.
With a comparison between these places, individuals living in Melbourn have the highest Use synonyms
percentage
of going to cafes in the Use synonyms
last
4 weeks with 64% of all, Linking Words
however
, the data in Horbat and Sydney are so close to the number in Melbourn. Linking Words
On the other hand
, Horbat has the highest Linking Words
percentage
of Use synonyms
instant
Use synonyms
coffee
consumption, as more than half of the society has been a fan of these kinds of Use synonyms
coffee
in the Use synonyms
last
month. Adelaidians, Linking Words
therefore
, have the lowest Linking Words
percentage
Use synonyms
overall
for having hot drinks including tea and Linking Words
coffee
with only half of the notion buying Use synonyms
instant
Use synonyms
coffee
. Buying fresh Use synonyms
coffee
in the Use synonyms
last
month, Linking Words
however
, consists of the lowest Linking Words
percentage
in all of these five Australian Use synonyms
cities
, with the highest Use synonyms
percentage
belonging to Sydney with less than 45%.
Use synonyms
To conclude
, Australians in the five Linking Words
cities
mentioned are more likely to go to cafes Use synonyms
instead
of having either fresh or Linking Words
instant
Use synonyms
coffee
.Use synonyms