
This
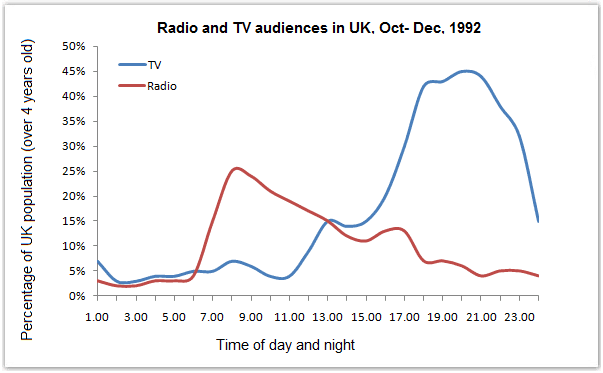
line chart depicts the figure of the population shown on Linking Words
TV
and Use synonyms
Radio
in the period between October and November of 1992. It is clear from the graph that were fluctuated to number of audiences for Use synonyms
Radio
and Use synonyms
TV
in the UK.
Use synonyms
According to
what is shown, increase to shows for the Linking Words
Radio
by 30 per cent on time 8 at noon.Use synonyms
then
drop significantly for audiences on the Linking Words
Radio
after time 9 noon until 2 per cent on 2 at midnight.other hand the Use synonyms
TV
started up and down in the period between 6 to 4 Use synonyms
then
there was a big climb in number of the shows by 50% in the UK.
Linking Words
To sum up
, we could say that,the number of audiences on Linking Words
TV
was greater than the Ridio in the United Kingdom in 1992 year.Use synonyms