
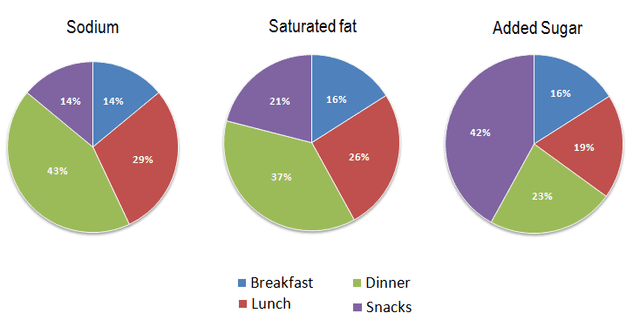
The pie charts illustrate the average proportions of three different nutrients consumed in the USA, all of which people may be harmful if consumed excessively.
Overall
, it can be seen that almost every nutrient has the same trend as each other, with a slight difference in Linking Words
proportion
for each part except added Use synonyms
carbohydrate
, which has a considerable discrepancy in snack meals.
Fix the agreement mistake
carbohydrates
According to
the pie charts, added sugar accounts for the largest Linking Words
proportion
, 42%, in snack meals, Use synonyms
whereas
Linking Words
sodium
and saturated fat in snack meals are 14% and 21%, which are less than added sugar by threefold and twofold, respectively. Use synonyms
In contrast
, people in the USA consumed Linking Words
sodium
in dinner,43%, which is the most considerable Use synonyms
proportion
, followed by saturated fat with 37% in dinner. Use synonyms
Also
, excess carbohydrate is added Linking Words
in
Change preposition
to
the
dinner as the lowest Correct article usage
apply
proportion
only 23%.
Use synonyms
Furthermore
, the percentages of several supplements are no different in breakfast grub, only 2% among themselves. The figures demonstrate a slight difference between the three of them in lunch by 10%, from the highest Linking Words
proportion
in Use synonyms
sodium
, 29%, to the lowest Use synonyms
proportion
in added Use synonyms
carbohydrate
, 19%, and saturated fat, almost the same Fix the agreement mistake
carbohydrates
proportion
as Use synonyms
sodium
, with 26%.Use synonyms