
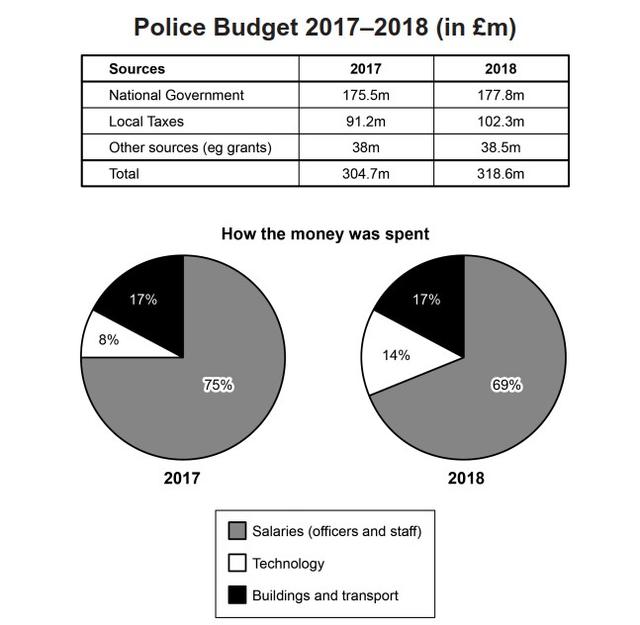
The presented table provides data about the use of police budget by various sources in 2 years, from 2017 to 2018. It is clear from the graph that , The illustrated pie charts demonstrate information on what the collected cash was spent.
According to
what is shown, in both years the vast majority of Linking Words
money
from the budget was financed by national governments, Use synonyms
whereas
a tiny minority was separated from other sources (grants). As can be seen in the first chart three out of the Linking Words
money
spent on officers Use synonyms
as well as
on staff’s salaries, Linking Words
however
approximately nine times less Linking Words
money
spent on technology. By 2018, all 3 source Use synonyms
options
showed an upward trend. Meanwhile, the top improvement was by local taxes 11.1m of growth. Use synonyms
Moreover
, spending Linking Words
money
by 2018 decreasedUse synonyms
salaries
Change the noun form
salary
options
, and stayed with no change in buildings and transport Use synonyms
options
, technology Use synonyms
options
showed a 6% rise.
Use synonyms
To sum up
, we could say that,The total figures for police budgets were 304.7m and 318.6m respectively.Linking Words