The bar chart below shows the percentafe of australian men and women in diffrent age groups who did regular physical activity in 2010. summarise the information by selecting and reporting the main features, and make comparisons where relevant.

The bar chart below shows the percentafe of australian men and women in diffrent age groups who did regular physical activity in 2010.

summarise the information by selecting and reporting the main features, and make comparisons where relevant.
The bar chart illustrates
percentage
Add an article
the percentage
show examples
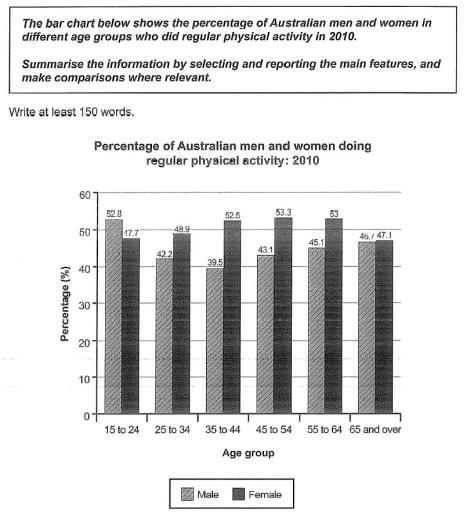
of Australian men and women, who exercised regularly in 2010
,
Remove the comma
apply
show examples
and categorizes
Correct pronoun usage
them in
show examples
in
Change preposition
into
show examples
six age groups.
Overall
, approximately half of the population did physical activities regularly, with men
tend
Wrong verb form
tending
show examples
to do more physical activity in almost all age groups, except in the youngest group.
Submitted by pimpisut.sata on

Unauthorized use and/or duplication of this material without express and written permission from this site’s author and/or owner is strictly prohibited. Excerpts and links may be used, provided that full and clear credit is given to Writing9 with appropriate and specific direction to the original content.

Sentences: Add more complex sentences.
Linking words: Add more linking words.
Basic structure: Write more paragraphs.
Basic structure: Add more body paragraphs.
Common mistake: Your writing should be 150-250 words.
Basic structure: Write more paragraphs.
Vocabulary: Only 5 basic words for charts were used.
What to do next:
Look at other essays: