
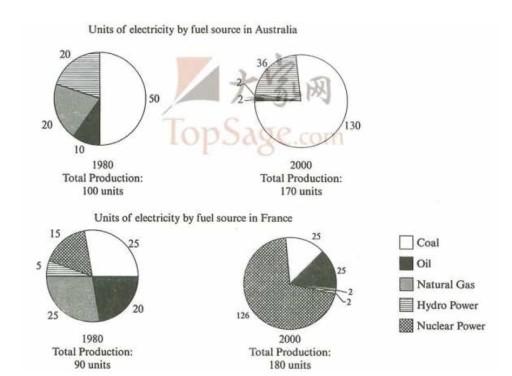
The graphs provide a clear visual image of the proportion of electricity units that use 5 different types of fuel in
France
and Use synonyms
Australia
in 1980 and two decades later.It is clear from the graph that , Coal is the most common source of electricity in Use synonyms
Australia
in both mentioned years. Use synonyms
Also
, Coal and Linking Words
Hydropowerpower
were the most productive files in 1980 in Correct your spelling
hydropower power
France
which were replaced by Nuclear power up to 2000.
Use synonyms
According to
what is shown, the tendency for hydropower power during these years stayed almost the same in Linking Words
Australia
from 20 units among 100 to 36 units among 170. Use synonyms
Moreover
, Linking Words
this
type of energy is the least popular one among others in Linking Words
France
which takes part under 10 per cent of total use.
Use synonyms
To sum up
, we could say that, Another mentionable source is Nuclear power which made nearly two-thirds of Linking Words
France
's electricity in 2000 but it was not used in Use synonyms
Australia
either in 1980 or 2000.Use synonyms