
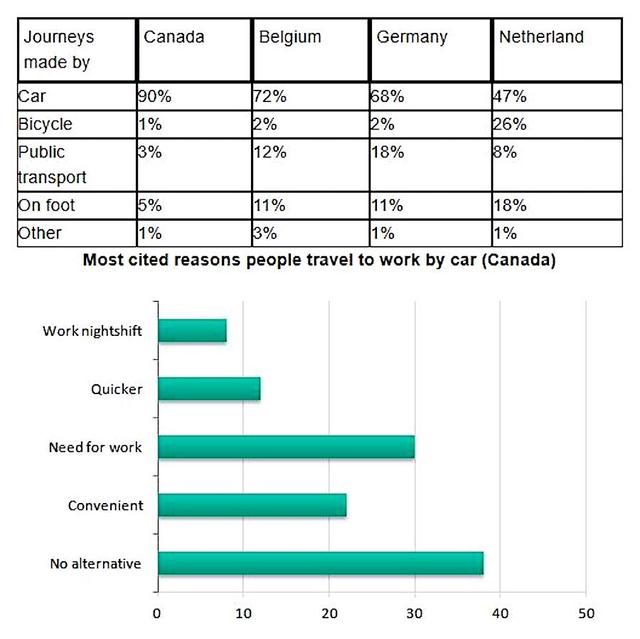
The table compares modes of
transport
used in four countries: Use synonyms
Canada
, Belgium, Germany and the Netherlands, and the percentage of journeys made by Use synonyms
car
, bicycle, public Use synonyms
transport
and on foot. The bar chart shows the results of a survey into reasons people in Use synonyms
Canada
travel to work by Use synonyms
car
.
As can be seen from the table, cars were the most frequently used Use synonyms
from
of Correct your spelling
form
transport
in all four countries. Use synonyms
However
, the proportion of journeys made by Linking Words
car
ranged from a low of 47 per cent in the Netherlands to a high of 90 per cent in Use synonyms
Canada
. Figures for other forms of Use synonyms
transport
Use synonyms
also
varied considerably. Not surprisingly, in the Netherlands, a high proportion of trips were made by bicycle (26%) and on foot (18%). The highest rate of public Linking Words
transport
use was in Germany, where nearly one in five journeys was made by public Use synonyms
transport
.
The bar chart provides information that may help explain why Use synonyms
car
use in Use synonyms
Canada
. The most frequently cited reason was Use synonyms
lack
of any other alternative (38%). Correct article usage
the lack
Although
a sizable percentage said it was more convenient (12%), the other factors listed appeared to relate more to need than preference, e.g. working Linking Words
night
shift.
Correct article usage
the night
Overall
, the figures show considerable variation in modes of Linking Words
transport
used, though the Use synonyms
car
continues to dominate.Use synonyms