
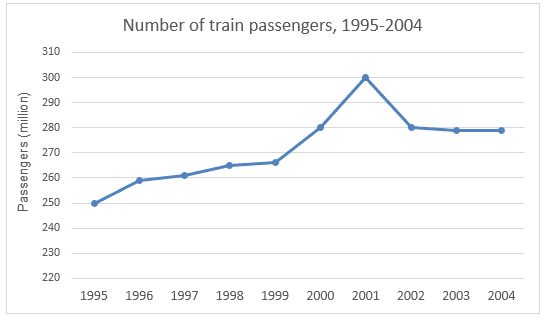
The two given line graphs provide us with information
with
the number of train Change preposition
on
passengers
on the one side, and the percentage of trains running on time on the other side, in Sydney between the years 1995 and 2004. The number of Use synonyms
passengers
is presented in millions.
What Use synonyms
initially
stands out in the first graph is the all-time high of Linking Words
passengers
in the Use synonyms
year
2001, reaching a soaring 300 million Use synonyms
travelers
. Change the spelling
travellers
Nevertheless
, the numbers dropped significantly one Linking Words
year
later, counting 20 million Use synonyms
less
Change the quantifier
fewer
passengers
. The sum Use synonyms
further
stabilized itself and showed no significant changes between Linking Words
years
2003 and 2004.
Correct article usage
the years
On the other hand
, the biggest change in the percentage of trains running on time is noticed as the numbers drastically plummet from Linking Words
Use synonyms
year
2003 to Change the article
the year
Use synonyms
year
2004, falling from just above 90 per cent to a little over 70 Change the article
the year
percent
. Change the spelling
per cent
However
, Linking Words
this
was not the only slump in the mentioned graph. Linking Words
Likewise
, the numbers were continuously falling between the years 1995 and 1997, Linking Words
as well as
199 and 2000, Linking Words
although
not as sharply.Linking Words