
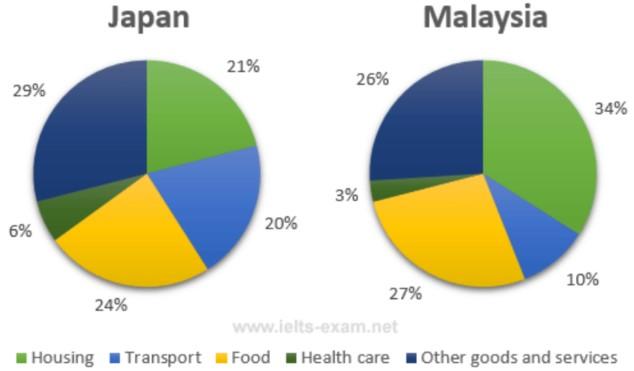
The provided chart gives the breakdown of the average expenditure of Japanese and Malaysian households in 2010 where units are measured in percentage.
Overall
, we can clearly see that the average amount is mostly spent on housing, food, transport and other goods and services for both of the countries, Linking Words
in contrast
, the expenditure is quite low on health care.
In Malaysian households, there was the greatest portion of spending on housing, at 34% of total expenditure, Linking Words
while
the part for Japanese people was just 21%. They witnessed the largest spending on other goods and services at 29% Linking Words
whereas
, it was slightly lower in Malaysia, just 26% of total spending.
Linking Words
Moreover
, regarding spending on food, these two countries, shared almost the same amount, 24% in Japan, and 27% in Malaysia. Linking Words
On the other hand
, health care service was the smallest proportion of spending for both countries. Malaysian families spend 3% on them. Linking Words
However
, the number for transport is a bit higher, at 10%. But, these statistics for household and healthcare doubled in Japan, at 6% and 10%, respectively.Linking Words