
This
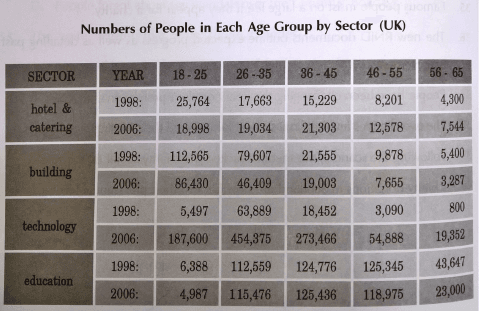
table presents the number of people who were working in various age groups in different sectors during the years 1998 to 2006.
Linking Words
Overall
, it demonstrated that the comparison of statistics about individuals in 5 age groups was divided into 4 certain sectors in two time periods. It is obvious that most employee members in 1998 worked in the building industry Linking Words
while
it can be seen that fewer Linking Words
poeple
had technological jobs.
Correct your spelling
people
In contrast
, we witnessed a considerable rise in the numbers in 2006 compared to 1998 at all rate of ages. Linking Words
Also
, it is noticeable that the workers in the building job categories remarkably decreased in Linking Words
ech
age group.
Correct your spelling
each
In addition
, there are some slight changes in the education field. More importantly, Linking Words
it is clear that
the amount of Linking Words
youngest
and the oldest groups of workers in all industries Correct article usage
the youngest
leveled
off except tech members.Change the spelling
levelled