The graphs below give information about computer ownership as a percentage of the population between 2002 and 2010, and by level of education for the years 2002 and 2010.

The graphs below give information about computer ownership as a percentage of the population between 2002 and 2010, and by level of education for the years 2002 and 2010.
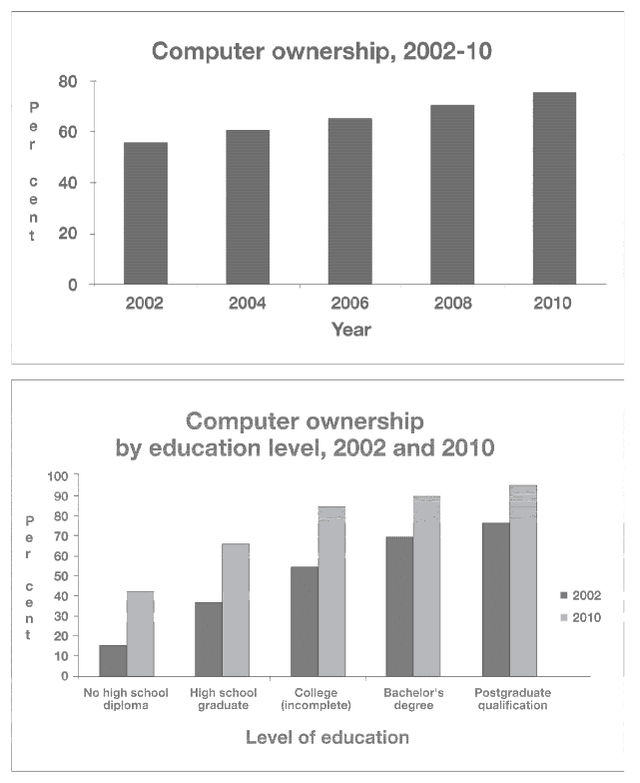
The chart illustrates the ownership of computers from 2002 to 2010 and the related education level of owners.
Overall
,
It is clear that
the tendency of people who have a computer is on the rise. Meanwhile, the amount of computers increases with the degree level. Over 55% of individuals had computers in 2002 and gradually increased to over 70% in 2010 which was the highest point at the time. In 2009, the percentage of someone who had a postgraduate qualification was the highest at 70%,
in contrast
, someone who did not have a high school diploma only was the lowest at 15%.
Moreover
, after eight years, the rate of individuals who have no high school diploma rises to 40%. When it comes to high school graduated persons, it grew by 30%, from around 35% to 65%, and other degrees are
also
over 50%, especially the level of postgraduate, which reaches a peak at 90%
Submitted by anzuman.asha13 on

Unauthorized use and/or duplication of this material without express and written permission from this site’s author and/or owner is strictly prohibited. Excerpts and links may be used, provided that full and clear credit is given to Writing9 with appropriate and specific direction to the original content.

Sentences: Add more complex sentences.
Vocabulary: The word "increases" was used 2 times.
Vocabulary: The word "rise" was used 2 times.
Topic Vocabulary:
  • trend analysis
  • population demographics
  • educational attainment
  • disparities
  • technological advancement
  • digital divide
  • market penetration
  • socio-economic factors
  • predictive insights
  • statistical significance
  • longitudinal study
  • accessibility
  • affordability
What to do next:
Look at other essays: