
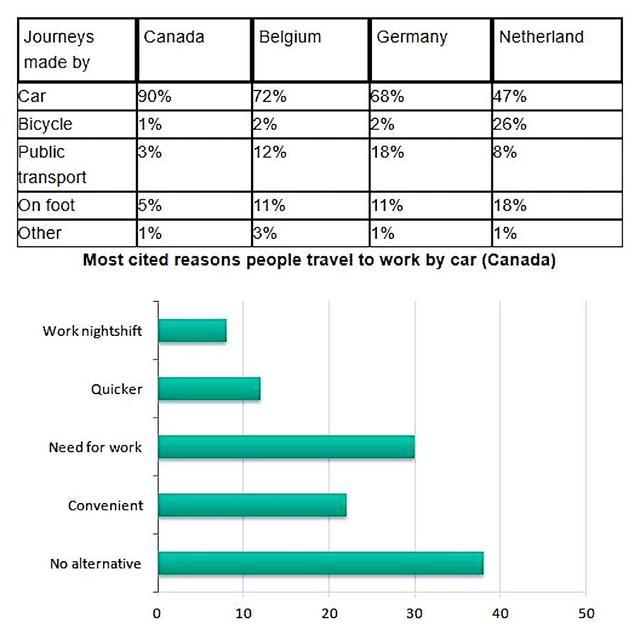
The table illustrates data regarding which mode of transportation is utilized during travelling in four parts of the world,namely Canada,Belgium, Netherlands and Germany,
whereas
the bar chart gives information about why people are inclined to use cars Linking Words
while
they are commuting in Canada.
Linking Words
Overall
,what stands out from the graphs is that in all countries,people use their personal vehicles for journeys.Linking Words
Furthermore
,the primary factor for travelling by car is that people do not have any other alternative.
Looking into detail,in Canada,the vast majority of the citizens wield cars to go where they want and it sets the first place among the four countries.Bicycles are the Linking Words
last
used form of transportation,except in İreland.Other modes of vehicles are not utilized as much and are less than one-fifth in all areas.
With regard to the bar chart, inhabitants commute to work mostly through the use of cars as they have no other chance and it ranked first with 40%.Other contributing reasons are the need for work and time efficiency with 22% and 12% respectively.Meanwhile,changes in work time stand the Linking Words
last
with almost one-tenthLinking Words