
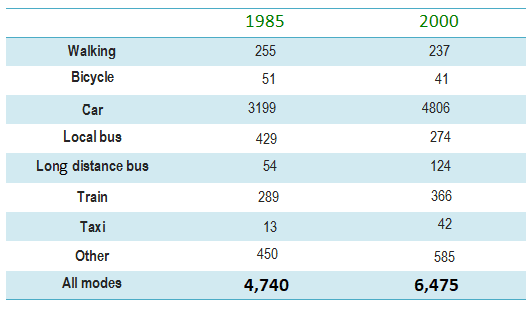
The table illustrates the information on the average distance travelled in miles per person per year by the various modes of transportation from 1985 and 2000.
Overall
, Linking Words
it is clear that
the car way of commute was the most popular than Taxi and Bicycle.
In detail, the car had the highest miles of travelling in the given two periods and it jumped from 3199 to 4806, from 1985 to 2000. The other mode of transit placed second in 1985, at 450 Linking Words
then
it increased slightly by 585. Linking Words
Similarly
, Train Linking Words
also
increased in the previous period from the given Linking Words
last
period, from 289 to 366. Linking Words
Likewise
, Long-distance buses and taxis both increased as compared to the previous periods, from 54 to 124 and 13 to 42 respectively.
Linking Words
In contrast
, using local buses accounted for 429 in 1985 but it decreased drastically by 274 in 2000. In the same Linking Words
manner
walking and bicycle mode of transit fell slightly from 255 to 237 and 51 to 41 respectively from 1985 to 2000.Add a comma
manner,