
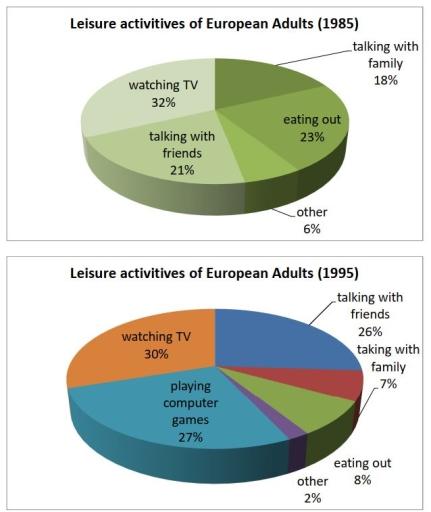
The
chart
illustrates the outcome of a survey regarding the different recreational Use synonyms
activities
of Europeans between 1985 and 1995.
Use synonyms
Overall
, the trend of Linking Words
activities
enjoyed by adults in Europe consists of two types: social interaction and the use of technology Use synonyms
such
as television and computer games with the former being less preferred than the latter.
In terms of the most significant feature of Linking Words
this
Linking Words
chart
, the largest category of Use synonyms
activities
being done for pleasure was watching television which accounted for more than one-quarter of the total venture. Use synonyms
Additionally
,the next segment that occupies 2nd on the Linking Words
chart
is computer games at 27%. When added together, both of these Use synonyms
activities
utilize the use of technology which covered more than half of the total slice of the pie Use synonyms
chart
.
In stark contrast, nearly more than two-fifths of Use synonyms
activities
which is at 43% require social interactions and outdoor plans. From others margin at 2% to talking with family at only 7% and conversing with friends at 26% which nearly competes with video games.Use synonyms