
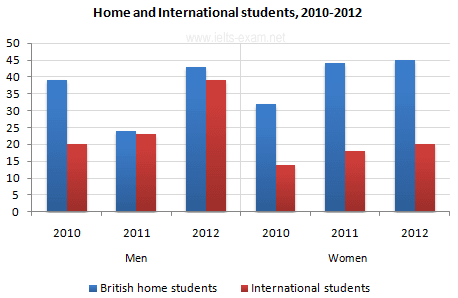
The given chart illustrates how many home and international
students
studied a particular subject in the UK between 2010 and 2012. Use synonyms
Overall
, it is evident that British Linking Words
students
had a superiority over those who came from overseas.
Looking into details, the figure for British male Use synonyms
students
stayed at under 40, which was twice as high as the Use synonyms
number
of international ones in 2010. The next year, the Use synonyms
number
of foreign and local university Use synonyms
students
was almost the same, at around 25. There was an increase in the Use synonyms
number
of international and home Use synonyms
students
to almost 40 and 43, respectively in 2012.
As regards the figures for females, there were small disparities in the Use synonyms
number
of university Use synonyms
students
who came from other countries, which was under 20 during the whole period. The Use synonyms
number
of Use synonyms
students
who lived in the UK was over 30, which was followed by nearly 45 in the next 2 years.Use synonyms