
The
given
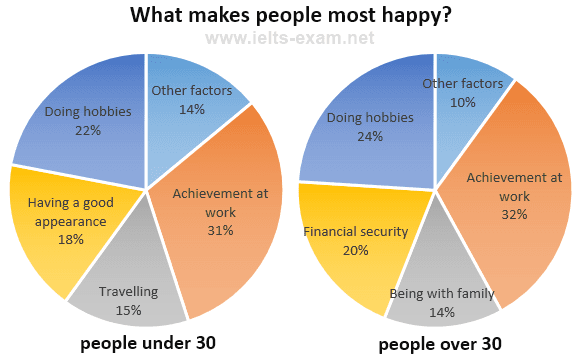
pie chart expresses the information what makes Verb problem
apply
people
most happy for two different age groups.
Use synonyms
Overall
, to be happy Linking Words
people
under 30 pick travelling and having a good appearance. Use synonyms
However
, Linking Words
in
the same Change preposition
at
time
Add a comma
time,
people
over 30 choose being with family and financial security. Meanwhile, Use synonyms
people
Use synonyms
for
two different age groups feel happy because of achievement at work.
Change preposition
from
According to
the Linking Words
information
22% of Add a comma
information,
people
under 30 feel happy doing hobbies and having a good appearance Use synonyms
make
Correct subject-verb agreement
makes
happy
18% of teenagers. Achievement at work Correct word choice
apply
produce
Verb problem
makes
people
Use synonyms
more happy
than other factors. 15% youngest Replace the words
happier
people
pick out travelling to be happy.
On Use synonyms
other
hand, being with family makes 14% of Correct article usage
the other
people
happy over 30. To feel happy 32% of Use synonyms
oldest
pick achievement at work. Correct article usage
the oldest
Differences
between choosing financial security and doing hobbies is 4% and Fix the agreement mistake
Difference
rest
of Correct article usage
the rest
people
over 30 pick out other factors to be happy.Use synonyms