
The
given
Verb problem
apply
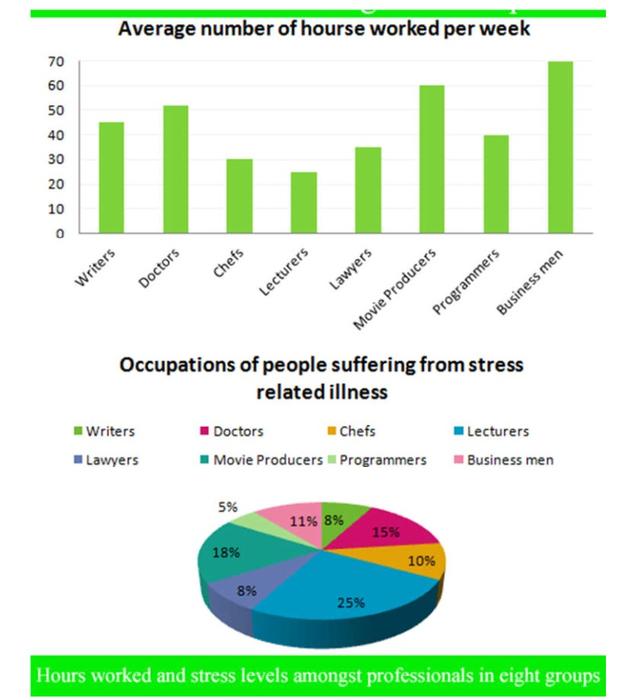
chart
illustrates how average work hours are distributed among different professions, Use synonyms
while
the pie Linking Words
chart
depicts the proportions of professional people who experience Use synonyms
stress
. Use synonyms
Overall
, the longest hours belong to Linking Words
business men
and a significant percentage of lecturers Correct your spelling
businessmen
Correct subject-verb agreement
are
is
under Correct subject-verb agreement
are
Correct article usage
apply
the
Correct article usage
apply
stress
.
Looking into detail, in terms of Use synonyms
bar
Correct article usage
the bar
chart
, Use synonyms
business men
rank Correct your spelling
businessmen
first,
with 70%, which is followed by movie Linking Words
procuders
, medical professionals, and writers, at 60%, 50%, and 45%, respectively. There is a small Correct your spelling
producers
disparitiy
between the figures for lawyers and programmers. Chiefs and lecturers work under 30 hours per week.
As regards Correct your spelling
disparity
disparities
pie
Correct article usage
the pie
chart
, the largest proportion of Use synonyms
stress
Use synonyms
level
refers to lecturers, which stands at a quarter. Fix the agreement mistake
levels
This
is followed by film producers, doctors, and Linking Words
business men
, at 18%, 15%, and 11%, in turn. The same percentage of lawyers and writers Correct your spelling
businessmen
suffers
from Correct subject-verb agreement
suffer
stress
, with 8%. Use synonyms
However
, fewer people who are Linking Words
programmer
experience Fix the agreement mistake
programmers
stress
, with just 5%.Use synonyms