
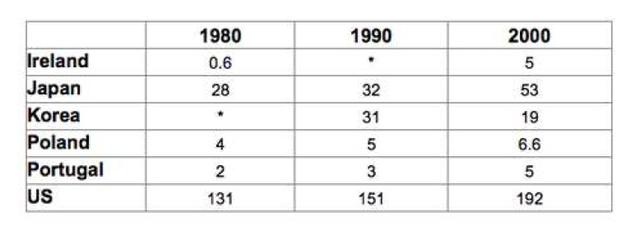
The table gives data about the amounts of
waste
materials produced by some particular countries, over a 20-year period between 1980 and 2000.
Looking from an Use synonyms
overall
perspective, it can be clearly seen that there were significant upward trends in five countries, Linking Words
whereas
Korea witnessed a decline during the period.
Looking into detail, the amount of Linking Words
waste
output in Ireland soared from 0.6 Use synonyms
million
to 5 Use synonyms
million
. Meanwhile, Japan’s Use synonyms
waste
materials increased dramatically from 28 Use synonyms
million
to 53 Use synonyms
million
. The figure for Korea underwent a fluctuation, jumping to 31 Use synonyms
million
in 1990 and declining to 19 Use synonyms
million
in 2000.
Use synonyms
In contrast
, there was a slight rise in the Linking Words
waste
produced by Poland from 4 Use synonyms
million
to 6.6 Use synonyms
million
. The Use synonyms
amounts
of Fix the agreement mistake
amount
waste
materials in Portugal increased marginally to 5 Use synonyms
million
like Use synonyms
Poland
. The production of Change preposition
in Poland
waste
in Japan decreased significantly from 31 Use synonyms
million
to 19 Use synonyms
million
over a 20-year period.Use synonyms