
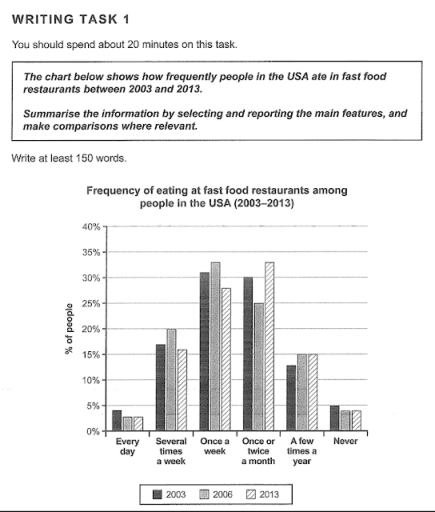
The bar chart illustrates
that
how frequently Correct word choice
apply
people
in the USA ate in fast Use synonyms
food
restaurants between Use synonyms
Use synonyms
Add an article
the year
a year
year
Fix the agreement mistake
years
of
2003, 2006 and 2013. There are 6 categories represented: eating Change preposition
apply
everyday
, several times a Replace the word
every day
week
, once a Use synonyms
week
, once or twice a month, a few times a Use synonyms
year
, and never.
In 2003, the highest Use synonyms
percentage
of Use synonyms
frequency
of eating fast Use synonyms
food
is almost 30%, and Use synonyms
people
Use synonyms
eating
fast Wrong verb form
eat
food
once a Use synonyms
week
. Use synonyms
Besides
, eating Linking Words
everyday
shows the lowest Replace the word
every day
percentage
, which is at under 5%, and it is similar to Use synonyms
Use synonyms
percentage
of Add an article
the percentage
people
who never ate fast Use synonyms
food
, which Use synonyms
at
5%.
In 2006, the Add a missing verb
is at
percentage
of Use synonyms
frequency
that Use synonyms
people
who Use synonyms
eating
fast Change the form of the verb
eat
food
once a Use synonyms
week
, over 30%, is the highest number. Use synonyms
On the other hand
, both the lowest and another lowest Linking Words
percentage
of Use synonyms
people
who ate fast Use synonyms
food
Use synonyms
everyday
, and never ate them show under 5%.
In 2013, unlike Replace the word
every day
Use synonyms
Change the article
the year
year
Fix the agreement mistake
years
of
2003 and 2006, the highest Change preposition
apply
percentage
of Use synonyms
frequency
eating at fast Use synonyms
food
restaurants is that eating fast Use synonyms
food
once or twice a month. Use synonyms
Besides
, the lowest Linking Words
percentage
of Use synonyms
frequency
is Use synonyms
same
as Correct article usage
the same
Use synonyms
Add an article
the year
a year
year
Fix the agreement mistake
years
of
2003 and 2006.
Change preposition
apply
Overall
, Linking Words
people
who ate in fast Use synonyms
food
Use synonyms
restaurant
Fix the agreement mistake
restaurants
tend
to increase between 2003 and 2006. Wrong verb form
tended
However
, the data suggest that Linking Words
people
were inclined to reduce Use synonyms
absorb
fast Verb problem
the consumption of
food
in 2013. Use synonyms
This
assumes that Linking Words
people
Use synonyms
realized
Wrong verb form
realise
that
the increasing importance of Correct word choice
apply
taking
healthy foods.Verb problem
eating