
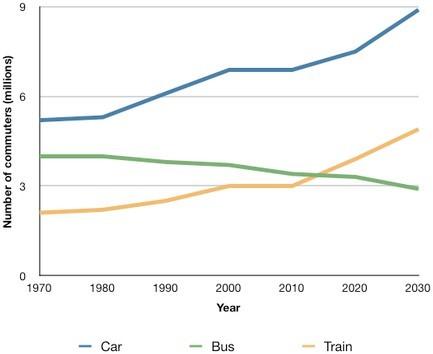
The line graph depicts information on the number of workers in the UK who
travelling
by three different modes of transport on average between 1970 to 2030.
Wrong verb form
travelled
Overall
, it is obvious that the car was by far the most preferred transportation for UK citizens throughout the given period.
In 1970, the UK people used cars more than the other two types of transportation at approximately 5 Linking Words
million
. The number minimally increased in 1980 Use synonyms
then
rose sharply from 1980 to 2000 , with about 8 Linking Words
million
, and remained steady until 2010. There was a steady increase, which is expected to continue, reaching a peak of 9 Use synonyms
million
in 2030.
The bus was the second most travelled mode in the graph, starting at just 4 Use synonyms
million
in 1970. Use synonyms
However
, users of buses declined gradually over these 60 years to finish at about 3 Linking Words
million
people.
Meanwhile, the Train was the least popular transport but showed a slow rise from 2 Use synonyms
million
in 1970 to finish at its peak, with 5 Use synonyms
million
in 2030.Use synonyms