
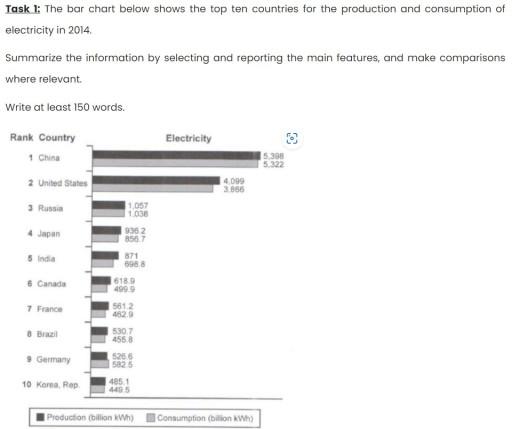
The bar chart shows the production and utilisation of power among ten nations in the year 2014.
Overall
, China produced and consumed the highest electrical energy, Linking Words
while
Korea's Rep. was the least for both cases.
Linking Words
However
, the amount of electricity generated by China was 5398 Linking Words
kwh
, Use synonyms
while
used 5322 Linking Words
kWh
. Use synonyms
United
States and Russia held second and third place with the Correct article usage
The United
generation
of 4099 Use synonyms
kWh
and 1057 Use synonyms
kWh
Use synonyms
,
and used lap 3866 Remove the comma
apply
kWh
and 1038 Use synonyms
kWh
respectively. Japan used 856.7 Use synonyms
kWh
against 936.2 Use synonyms
kWh
production. Use synonyms
Furthermore
, India used almost 200 Linking Words
kWh
less than their actual Use synonyms
generation
, which was 871 Use synonyms
kWh
.
Use synonyms
Moreover
, the power produced by Canada was 618.9 Linking Words
kWh
, Use synonyms
whereas
499.9 Linking Words
kWh
of power was transferred to use. Use synonyms
Moreover
, France and Brazil led to 563.2 and 530.7 Linking Words
kWh
electrons, Use synonyms
while
utilization was 462.9 Linking Words
kWh
and 455.8 Use synonyms
kWh
respectively. Germany utilized (582.5 Use synonyms
kWh
) more than the Use synonyms
generation
(5262nwh). Use synonyms
Finally
, the difference between Linking Words
generation
and consumption was 485-1 Use synonyms
kWh
and 449.5 Use synonyms
kWh
respectively in Korea Rep.Use synonyms