
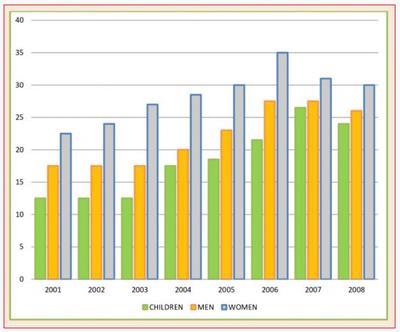
The bar chart represents the number of people that regularly had an appropriate daily portion of fruit and vegetable intake in the UK between 2001 and 2008. The information was categorised into three groups: men, women, and children.
Overall
, there is an upward trend in all groups, with the peak during 2006 and 2007, Linking Words
then
turning into a declining phase. The ladies were always the group with most people eating healthily throughout the years, Linking Words
while
the kids had a more significant rise than gentlemen.
Linking Words
According to
the graph, the males and youngsters remained unchanged during the first three years, Linking Words
then
started to increase in 2004, approximately 3% to 5% respectively. People continued to have more greens, with the highest percentage for men at around 27% occurring in 2006, Linking Words
then
minimally decreased. Same as the children, they peaked at 26% in 2007Linking Words
,
and slightly dropped to 24%.
Remove the comma
apply
On the other hand
, the women steadily rose from the beginning, roughly at the rate of 1-3% per year, and had the highest jump in 2006 with a 5% surge to 35%. Linking Words
Also
, their rate declined after 2006, down to 30%.Linking Words