
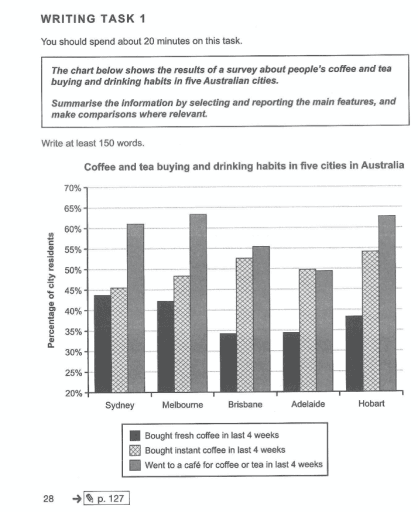
The chart reveals the percentages of residents'
coffeeand
tea purchasing habits in five Australian cities.61%of respondents in these cities visited cafes for Correct your spelling
coffee and
coffee
Use synonyms
ortea
in the past four weeks.
In Sydney, 44% and 45% Correct your spelling
or tea
ofresidents
purchased fresh and instant Correct your spelling
of residents
coffee
,respectively, in the past four weeks.A Use synonyms
comparablepattern
emerges for Melbourne and Hobart, with Correct your spelling
comparable pattern
similarproportions
of residents purchasing fresh Correct your spelling
similar proportions
coffee
, Use synonyms
instantcoffee
, and visiting cafes. Adelaide exhibits a Correct your spelling
instant coffee
preferencefor
instant Correct your spelling
preference for
coffee
and café visits, with Use synonyms
approximately50
% of residents having purchased instant Correct your spelling
approximately 50
coffee
Use synonyms
orfrequented
cafes in the past four weeks. Correct your spelling
or frequent
Brisbaneresidents
Correct your spelling
Brisbane residents
also
show a 34% rate for fresh Linking Words
coffeepurchases
, mirroring Adelaide's numbers.
Correct your spelling
coffee purchases
Overall
, Linking Words
Correct your spelling
the survey
thesurvey
reveals a consistent pattern in Correct your spelling
the survey
coffee
and Use synonyms
teapurchasing
habits across the five Australian citiesCorrect your spelling
tea purchasing