
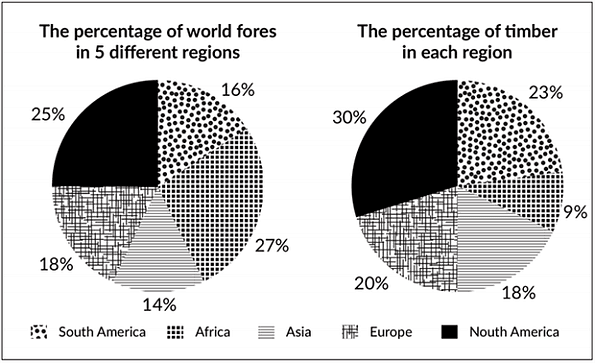
The given pie charts show the percentage of world forest and
timber
in five different continents
.
Use synonyms
Overall
, it can clearly be seen that Africa is the highest producer of forest Linking Words
while
it is the smallest in Linking Words
timber
. Use synonyms
Moreover
, the number of Linking Words
timber
is bigger rather than the forest for the other four regions.
In terms of jungles, the country with the biggest proportion is Africa at 27% followed by North Use synonyms
America
which accounted for one-fourth. The other three countries with less than one-fifth were Europe, South Use synonyms
America
, and Asia constituted 18%, 16%, and 14%, respectively.
Regarding the other natural sources, the percentage of Use synonyms
timber
in North Use synonyms
America
becomes the highest percentage at 30%. Recorded at 23%, the proportion in South Use synonyms
America
is the second biggest and the figure in Europe is the third at one-fifth. Use synonyms
Furthermore
, the share in Asia and Africa stands at 18% and 9%, respectively.Linking Words