
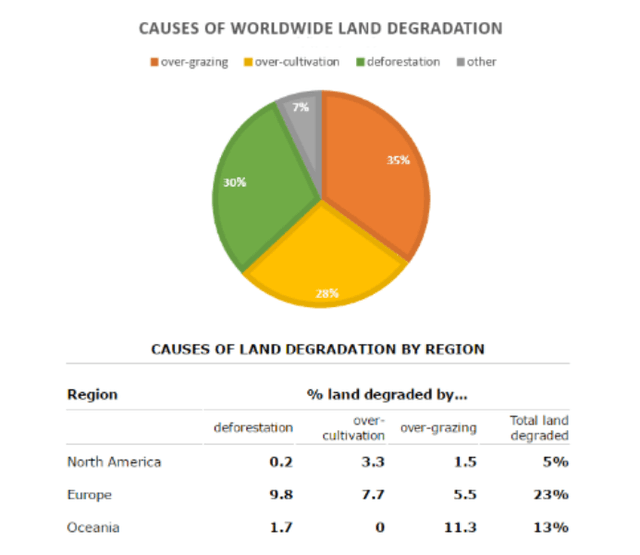
The pie chart compares the shares of the main causes of global
land
Use synonyms
degradation
, Use synonyms
whereas
the table illustrates the percentage of how three different regions were affected by degraded Linking Words
land
during the 1990s.
Use synonyms
Overall
, what stands out from the diagram is that over-grazing is the biggest reason why soil is degraded. Linking Words
Besides
, Europe was the region most affected by worldwide Linking Words
land
Use synonyms
degradation
.
Regarding the first one, over-grazing is responsible for the highest proportion of Use synonyms
land
Use synonyms
degradation
with 35%. There is little difference between the shares of deforestation and over-cultivation, as the former accounts for 30%, Use synonyms
while
the latter is lower by a margin of 2%.
The remaining 7% is responsible for a variety of other factors.
Linking Words
According to
the second one, Europe had the highest proportion of Linking Words
land
Use synonyms
degradation
with 23%, which was mainly caused by deforestation at approximately 10%. Use synonyms
This
is followed by the share of degraded soil in Oceania, with 13%. Linking Words
Additionally
, there was no observed over-grazing in Linking Words
this
area. In comparison, 5% of the Linking Words
land
was degraded in North America, and over-cultivation stood as the main cause with 3.3%.Use synonyms