
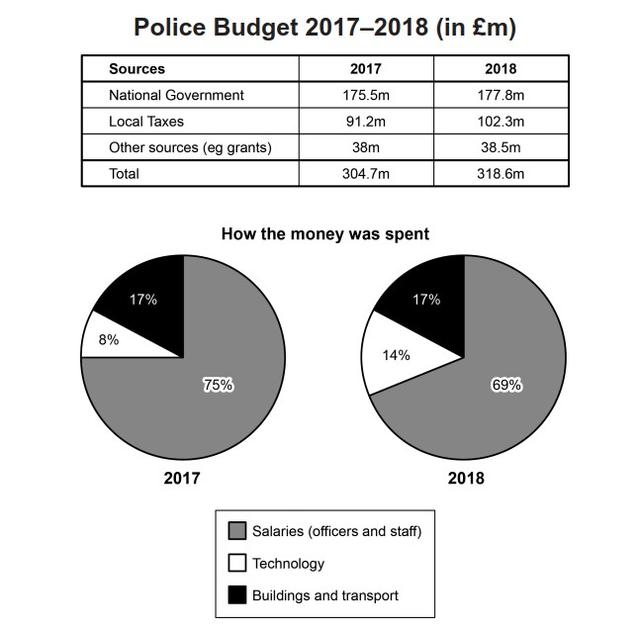
The table shows the three
sources
(national government, local taxes, Use synonyms
other
Correct word choice
and other
sources
) and the total amount in one area of the UK police Use synonyms
budget
for 2017 and 2018. Use synonyms
Linking Words
While the
pie chart illustrates the percentages of three different money uses in 2017 and 2018 (wages, technology, construction, and transportation). Units are measured in British Correct word choice
The
Pound
.
Fix the agreement mistake
pounds
Overall
, the highest Linking Words
source
in one area of the UK for the police Use synonyms
budget
in 2017 and 2018 was the national government, and the lowest Use synonyms
source
was other Use synonyms
sources
(grants). Salaries were the top Use synonyms
source
of money spending in both 2017 and 2018. Technology was the least expensive method in both 2017 and 2018.
Use synonyms
To begin
with the table, in the year 2017, the National Government as the largest Linking Words
source
of the political Use synonyms
budget
was 175.5m and it continued as the largest Use synonyms
source
of the political Use synonyms
budget
in 2018 at 177.8m. The Other Use synonyms
sources
Use synonyms
had been
found the lowest police Verb problem
apply
budget
in both 2017 and 2018, at 38m and 38.5m respectively. In total, the amount from the three Use synonyms
sources
in 2017 was 304.7 and it increased to 318.6m in 2018.
The pie chart, Use synonyms
on the other hand
, shows that there was a considerable portion of Linking Words
this
Linking Words
budget
is used to pay the salaries of officers and staff, which was 75 Use synonyms
Use synonyms
percent
in 2017 and fell to 69 Change the spelling
per cent
Use synonyms
percent
in 2018. As for the Change the spelling
per cent
budget
spent on Use synonyms
the
‘Technology’, it was 8 Correct article usage
apply
Use synonyms
percent
in 2017 and went up 6 Change the spelling
per cent
Use synonyms
percent
to 14 Change the spelling
per cent
Use synonyms
percent
in 2018. The category of ‘Buildings and transport’ provided 17 Change the spelling
per cent
Use synonyms
percent
of the Change the spelling
per cent
budget
each year.Use synonyms