
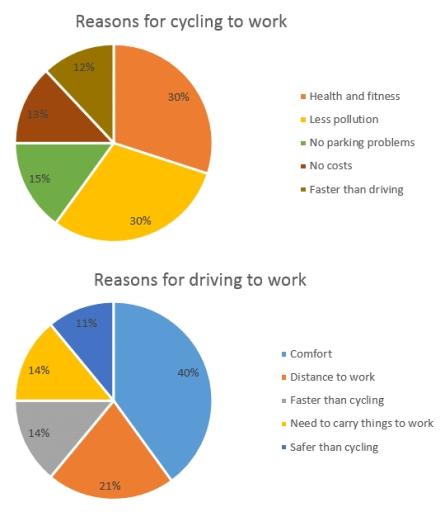
The given chart illustrates the vehicles of
people
Use synonyms
go
to Correct pronoun usage
who go
work
and the cause of of Use synonyms
this
. Linking Words
Overall
, the first chart shows the reasons why Linking Words
people
go to Use synonyms
work
by bicycle. And Use synonyms
conversely
, the second chart gives reasons for those who drive to Linking Words
work
.
The highest percentage of those who favour cycling say that because Use synonyms
of
cycling is good for health and reduces emissions Change preposition
apply
so
they tend to cycle. The figure for both reasons by the same at 30%. Meanwhile, the proportion of those who think there is not enough parking for cars is halved compared to those who cycle. Surprisingly, there is a small Correct word choice
apply
amount
of Change the quantifier
number
people
who think biking a cycle to go to Use synonyms
work
is faster than driving and does not waste costs , respectively at 12% and 13%
Use synonyms
In contrast
to Linking Words
this
, the percentage who prefer to travel by car because it is more comfortable is 40%. The figure for working distance ranked second at 21%. And the Linking Words
people
who usually need to carry some of their kinds of stuff to their company or feel driving is faster than cycling are the same point at 14%. And the Use synonyms
last
lowest one, 11% of Linking Words
people
who feel driving is less accident than cyclingUse synonyms