
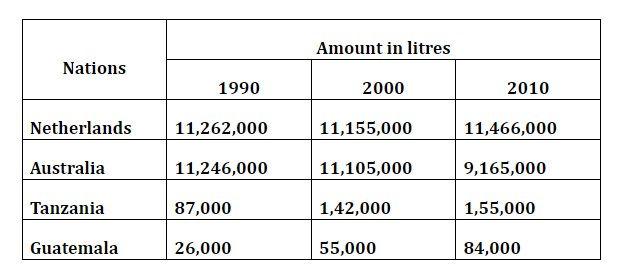
The given data shows the change in the annual
production
in one year in four different nations namely the Use synonyms
Netherlands
, Australia, Tanzania, and Guatemala) in 1990, 2000 and 2010 measured by Use synonyms
litres
Use synonyms
Overall
, Linking Words
while
the Linking Words
production
of Use synonyms
Netherlands
, Guatemala and Tanzania show an increasing trend, the figure for Australia declined over the given period.
Use synonyms
But
throughout the process, the Correct word choice
However
Netherlands
still was the largest Use synonyms
production
of Use synonyms
milk
.
In 1990,the Use synonyms
production
of the Use synonyms
Netherlands
was higher than other nations at 11,262,000 Use synonyms
litres
of Use synonyms
milk
, Use synonyms
then
dropped mildly to 11,155,000 Linking Words
litres
of Use synonyms
milk
in 2000 before reaching a peak at 11,466,000 Use synonyms
litres
of Use synonyms
milk
in
2010. The figure for Tanzania was much lower than that in the Use synonyms
Netherlands
. In the first period with 87,000 Use synonyms
lites
of Correct your spelling
litres
milk
Use synonyms
then
dramatically from 142,000 Linking Words
litres
to 155,000 Use synonyms
litres
of Use synonyms
milk
over the 10 years from 2000.
Use synonyms
Likewise
, the quantity of Linking Words
milk
Use synonyms
production
showed an upsurge to more than double in 2000 to reach 55,000 Use synonyms
lites
from 26,000, and it considerably improved to 84,000 Correct your spelling
litres
litres
in 2010.
Use synonyms
In contrast
, the annual Linking Words
milk
Use synonyms
production
rate in Australia had a steady downward trend from 11,246,000 Use synonyms
litres
in 1990 to 9,165,000 Use synonyms
litres
in 2010 after reaching
11,105,000 in 2000.Use synonyms