
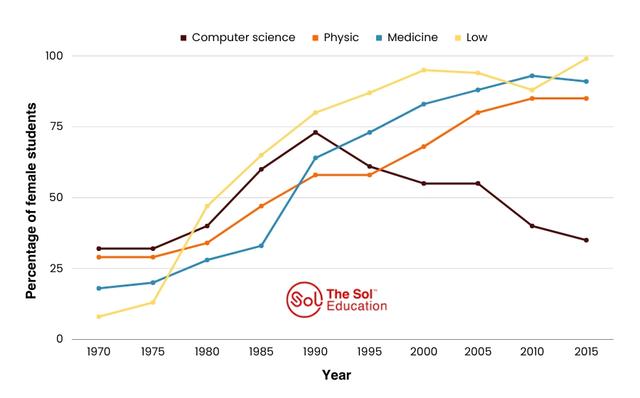
Given is a line graph depicting the proportional representations of college girls enrolled in four courses during the
period
from 1970 to 2015.
It is evident that there was an upward trend in the major subjects, Use synonyms
while
a downward trend in computer science in the latter half of the Linking Words
period
.
As can be seen in the graph, the law subject increased slightly from 1970 to 1975. Use synonyms
Then
, Linking Words
this
subject skyrocketed from around 10% to just under 100% in the following 25 years before fluctuating in the remaining 15-year Linking Words
period
. Use synonyms
On the other hand
, the physics course and medicine course rose exponentially from approximately a quarter to nearly 90% during the Linking Words
period
in question.
There was an opposite trend in computer science. During the first ten years, Use synonyms
this
subject grew gently from about 30% to roughly 35%. Linking Words
Then
, there was a surge from 1980 to 1990 before peaking at well under 75%. After that, the following Linking Words
period
from 1990 to 2015 saw a notable decline in computer science before the proportion reached a bottom of 30% in 2015 as much as in 1970.Use synonyms