
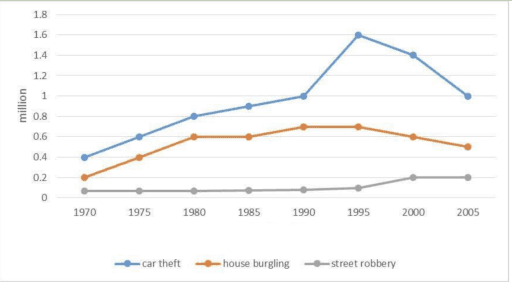
The line graph illustrates the number of three different crimes which are recorded in Great Britain and Wales between 1970 and 2005.
According to
the figure, it can be seen that Linking Words
car
Use synonyms
theft
in both countries is more likely to happen compared to others. Use synonyms
However
, it seems like people are not getting robbed by street robberies.
At the beginning of the period, Linking Words
car
Use synonyms
theft
and house Use synonyms
burgling
accounted for 0.40 Replace the word
burglary
million
and 0.20 Use synonyms
million
respectively. Both of the crimes had a similar trajectory until 1980 when the Use synonyms
car
Use synonyms
theft
still steadily climbed up Use synonyms
while
the burgling hovered and increased again in 1985. By the year 1990, the Linking Words
car
Use synonyms
theft
was about 1.00 Use synonyms
million
and the house burglar occupied 0.70 Use synonyms
million
. There was a fluctuation in Use synonyms
car
Use synonyms
theft
from 1990 to 2005 before it ended at the same number as in 1990 Use synonyms
as well as
the house burgling which declined to 0.50 Linking Words
million
in 2005.
Use synonyms
On the other hand
, street robbery stayed constant throughout the period from 1970 to 1990 which registered just under 0.05 Linking Words
million
. Afterwards, it moderately rose to 0.20 Use synonyms
million
in 2000 and levelled off until the end of the period.Use synonyms