
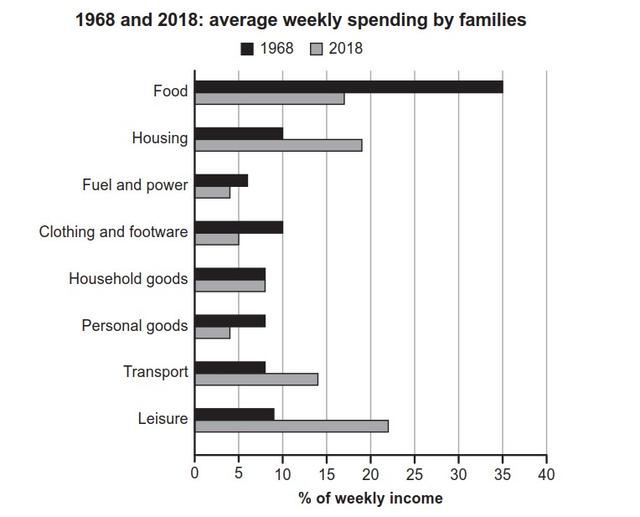
The bar chart below informs about the weekly income spending of families in a country in 1968 and 2018. The three most items bought were food, housing, clothing and footwear in 1968. Fifty years later, families were most likely spending their weekly salary on leisure, housing, and food. Different trends happened for other commodities in half a century.
The most dramatic change was the consumption of food with 35% of money spent in 1968 and it decreased to around 17% in 2018. Other commodities that had a decline were fuel and power, clothing and shoes or sandals, and personal goods.
On the other hand
, there were commodities that became more popular in these 50 years, namely housing, transport, and leisure. The most rocketing item was leisure, with a rise of 13% in weekly income spent. The second one from the chart was housing, which increased from 10% to 19%.
Linking Words
In contrast
with the mentioned goods, there was one thing that did not change in 50 years, it was household furniture. Around 8% of the weekly wages were spent on it.Linking Words