
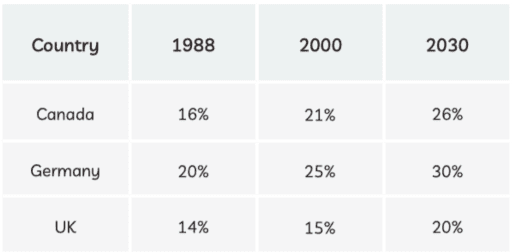
The table illustrates the percentages of people who are over 65 years old in
three
nations in 1988, 2000, and 2030.
Use synonyms
Overall
, Linking Words
it is clear that
all Linking Words
three
places are Use synonyms
aging
, and senior citizens are increasing. Change the spelling
ageing
That is
a big problem they have to face in the future. The proportion of Germany was the highest in these Linking Words
three
different years, and the UK has the lowest percentages in the table during the times. Use synonyms
As a result
, Linking Words
Canada
is always in the second position.
Looking at the table more closely, one can see that Use synonyms
Canada
and Germany increased 5% each time. Great Britain Use synonyms
however
, in the first 12-year period, the figure was nearly no change. Linking Words
Subsequently
, Britain gained 5%. In 1988, Linking Words
Canada
's and the UK's numbers were closer, and the gap was around 2% but in 2000, the gap became bigger, and it accountedUse synonyms
5
%. The difference between Change preposition
for 5
Canada
and Germany was kept Use synonyms
in
5% at Change preposition
at
three
different times.Use synonyms