
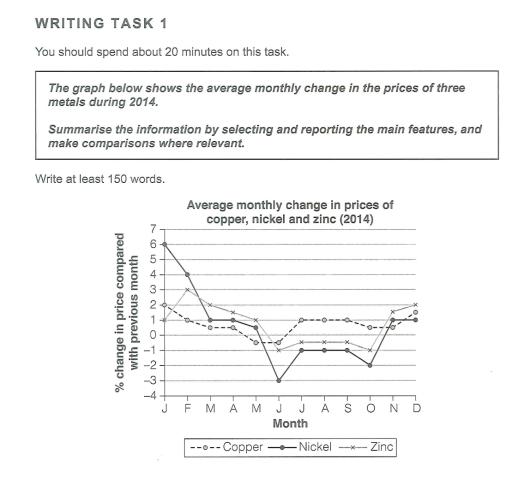
The line graph depicts the price variation of copper,
Nickel
, and Zink each month in 2014.
Use synonyms
Overall
, Linking Words
it is clear that
Linking Words
Nickel
's cost experienced wider changes ranging from -3 to 6 per cent compared to their previous month's price, Use synonyms
while
the price of Copper fluctuated more gently between just below -0.5% and 2%. Linking Words
Also
, all the figures witnessed their minimum change in June, when the sharpest fall occurred for Linking Words
Nickel
throughout the period.
Having seen the highest variation in total with 6%, Use synonyms
Nickel
Use synonyms
then
plummeted in the next two months, remaining at around 1% until May. Linking Words
Following
Linking Words
this
it declined steeply again, reaching its lowest amount in June. Regarding Zink, it started at 1%, Linking Words
then
leapfrogged Copper by the next month, peaking at 3%. Linking Words
Then
, the figure decreased gradually, and by June, it had reached -1%, making it slightly lower than Zink.
In July, the lines followed a similar trend, rising a certain amount, spanning from 0.5 to 2 per cent, reaching a plateau that remained there for the next two months. Linking Words
Finally
, they rose significantly, by approximately 1% to 3% percent until December.Linking Words