
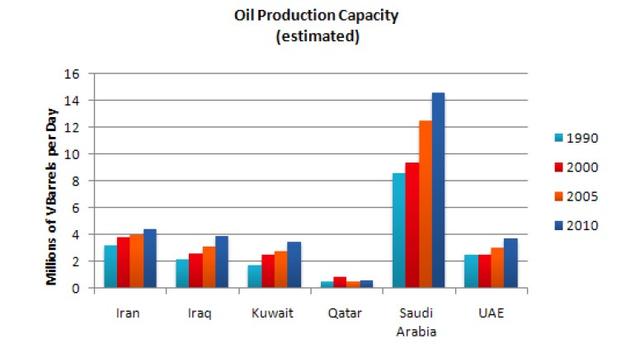
The given bar graph illustrates the changes in the
oil
production capacity in millions of barrels per day in six nations from 1990 to 2010.
Looking from an Use synonyms
overall
perspective, it is readily apparent that Linking Words
Saudi
Use synonyms
Arabia
remained the highest in producing Use synonyms
oil
. Use synonyms
While
Qatar remained the least in the time period given.
With regards to the Linking Words
Oil
production capacity in 1990, the most significant share was Use synonyms
Saudi
Use synonyms
Arabia
almost 8 million. From 1990 to 2010, similar Use synonyms
oil
accounted for Iraq and Kuwait, which was nearly 4 million. The same following the year a minute discrepancy can be seen the Use synonyms
Saudi
Use synonyms
Arabia
and Qatar, as the former was $ 12 Use synonyms
bn
, Use synonyms
while
the latter was $ 2 Linking Words
bn
. Iran showed an upward trend over Use synonyms
20-year
period of time. In 1990 and 2005 UAE stood in the same position At above 2 Add an article
a 20-year
the 20-year
bn
.
Use synonyms
In contrast
, Linking Words
Saudi
Use synonyms
Arabia
ranked the first up to 14 Use synonyms
bn
, Use synonyms
While
Qatar notched the Linking Words
last
rank with 2 Linking Words
billions
. The respective figure for UAE was approximately 3 Change to singular
billion
bn
between 2005 and 2010.Use synonyms