
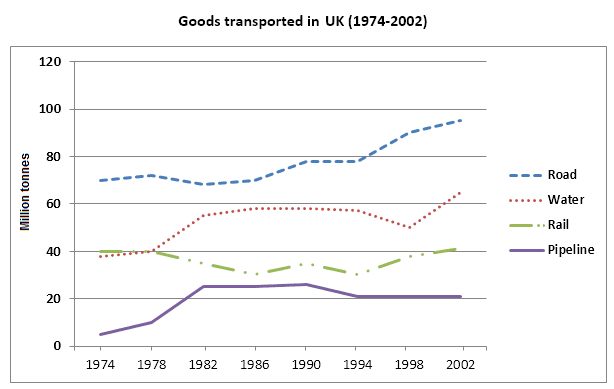
The line graph illustrates the proportion of foods transported in the UK between 1974 and 2002.
Overall
, road and water witnessed the highest increase in transportation usage for food during the period, whilst pipelines and rail experienced the wildest fluctuation.
Road saw a significant increase of around 70 Linking Words
million
Use synonyms
tonnes
in 1974 to nearly 100 Use synonyms
million
Use synonyms
tonnes
in 2002. water was in the second position and witnessed a dramatic increase of almost 40 Use synonyms
million
Use synonyms
tonnes
in 1978 to below 60 Use synonyms
million
Use synonyms
tonnes
in 1982 before decreasing steadily to almost 50 Use synonyms
million
in 1998 Use synonyms
then
increasing dramatically in 2002.
Linking Words
On the other hand
, rail saw the wildest fluctuation during the period. Rial decreased from approximately 40 to around 30 Linking Words
million
Use synonyms
tonnes
in 1986 before increasing sharply to around 30 Use synonyms
million
Use synonyms
tonnes
in 1998 to above 40 Use synonyms
million
Use synonyms
tonnes
in 2002. The pipeline was the lowest way to transport food, Use synonyms
although
increased dramatically from below 20 Linking Words
million
Use synonyms
tonnes
in 1974 to above 20 Use synonyms
million
in 1982 after that the pipeline rose slightly up to 1990 before decreasing to 20 Use synonyms
million
Use synonyms
tonnes
in 2002.Use synonyms