
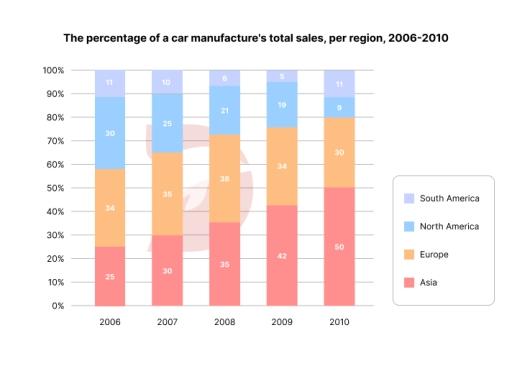
The given chart depicts the proportion of a
car
Use synonyms
factory
's total Use synonyms
sales
each Use synonyms
year
in four different continents including Use synonyms
Asia
, Europe, Use synonyms
South
Correct word choice
and South
America
, Europe and Use synonyms
Asia
between 2006 and 2010.
Use synonyms
Overall
, it can be seen thatLinking Words
,
the total Remove the comma
apply
sales
of the Use synonyms
car
Use synonyms
factory
in Use synonyms
Asia
experienced an upward trend Use synonyms
while
the opposite was true with South Linking Words
America
. Use synonyms
Beside
, there was a fluctuation in the total Replace the word
Besides
sale
of the Fix the agreement mistake
sales
car
Use synonyms
factory
in South Use synonyms
America
and North Use synonyms
America
.
Use synonyms
To begin
with, the percentage of total Linking Words
sales
of the Use synonyms
Asia
Use synonyms
car
Use synonyms
factory
started at 30% in 2006 and increased to 34% in 2007. It Use synonyms
then
remained stable in the next Linking Words
year
and peaked at 50% in 2010. If we look at South Use synonyms
America
, the trend is different. The proportion of total Use synonyms
sales
of the South Use synonyms
America
Use synonyms
factory
began at 30% and it Use synonyms
then
remarkably decreased by a Linking Words
hafl
in the next three years. The figure continuously went up and finished at below 10%.
Moving on to the other categories, the percentage of the Europe Correct your spelling
half
car
Use synonyms
factory
's total Use synonyms
sales
started at about 30% in 2006 and it Use synonyms
then
rose by 6% in the next two Linking Words
Use synonyms
year
. Fix the agreement mistake
years
However
, the figure Linking Words
witness
a decrease to around 30% in the Change the form of the verb
witnessed
last
Linking Words
year
. If we look at North Use synonyms
America
, the trend is similar. In the first Use synonyms
year
and Use synonyms
last
Linking Words
year
, the Use synonyms
propotion
of total Correct your spelling
proportion
sales
of the North Use synonyms
America
Use synonyms
factory
was Use synonyms
same
, which was 10%. The figure experienced a rapid decline from 2007 to 2009 and hit the bottom at below 5% in 2009.Correct article usage
the same