
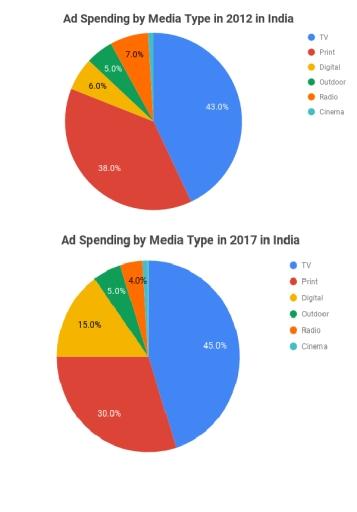
The pie chart illustrates the proportion of advertising spending by various sorts of media in India between 2012 and 2017.
it is clear that
TV had the main part of advertising Linking Words
although
, the cinema had the lowest stage.
Linking Words
According to
figures, investment Linking Words
on
TV commercials increased by 2% in five years Change preposition
in
moreover
, Digital signs climbed remarkably from 6% to 15% Linking Words
however
, Print notices dropped moderately from 38% to 30%Linking Words
Change preposition
apply
besides
, Linking Words
radio
announcements decreased minimally by 3% at the same time.
Focusing on outdoor advertisements, showed that Correct word choice
and radio
this
method maintained the same level at 5% from 2012 to 2017. Cinema had a negligible sector in Linking Words
compares
to other forms of notice and Replace the word
comparison
decline
slightly from 2% to 1% between 2012 to 2017.Wrong verb form
declined