The table and charts below give information on the police budget for 2017 and 2018 in one area of Britain. The table shows where the money came from and the charts show how it was distributed. Summarise the information by selecting and reporting the main features, and make comparisons where relevant.

The table and charts below give information on the police budget for 2017 and

2018 in one area of Britain. The table shows where the money came from and

the charts show how it was distributed.

Summarise the information by selecting and reporting the main features, and

make comparisons where relevant.
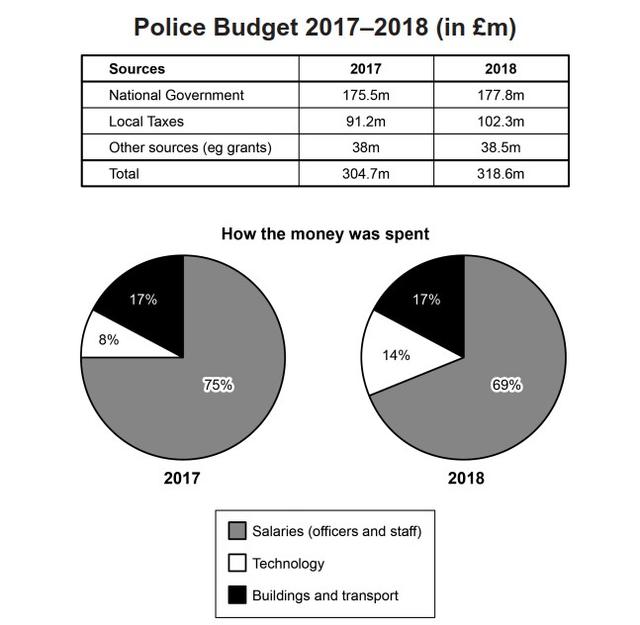
The table provides information about the sources of police
fundings
Fix the agreement mistake
funding
show examples
,
whereas
the pie charts illustrate to which sectors
money
was allocated in 2017 and 2018 in
the
Correct article usage
a
show examples
particular area of Britain.
Overall
, most of the investments came from the local government and a large amount of
money
was spent on
officers
Change noun form
officers'
officer's
show examples
and staff’s revenues in both years.
According to
the table,
an
Correct article usage
the
show examples
overall
number of the
fundings
Fix the agreement mistake
funding
show examples
constituted over
the
Correct article usage
apply
show examples
300 million pounds in both 2017 and 2018.
While
over a half of the total
money
was allocated from the national government, the local taxes were significantly lower than that of
the
Correct article usage
apply
show examples
certain authorities, comprising only a third of the total
fundings
Fix the agreement mistake
funding
show examples
in the given years. Meanwhile, other resources
such
as grants remained almost unchanged,
which
Correct your spelling
with
show examples
the figure
accounted
Wrong verb form
accounting
show examples
for 38 million. Regarding the pie charts, it is obviously seen that the employees’ salaries dominated the spending
money
with around 70%. In terms of buildings and transport expenditures, the figure maintained the same level at 17%;
however
, technological expenses experienced a slight increase from 8% to 14% in 2018.
Submitted by writingbhos on

Unauthorized use and/or duplication of this material without express and written permission from this site’s author and/or owner is strictly prohibited. Excerpts and links may be used, provided that full and clear credit is given to Writing9 with appropriate and specific direction to the original content.

Linking words: Don't use the same linking words: "overall".
Vocabulary: Rephrase your introduction. Words match: 67%.
Vocabulary: Replace the words money with synonyms.
Vocabulary: Rephrase the word "information" in your introduction.
Vocabulary: The word "charts" was used 2 times.
Vocabulary: The word "table" was used 2 times.
Vocabulary: The word "figure" was used 2 times.
Topic Vocabulary:
  • Fiscal allocations
  • Revenue streams
  • Budgetary oversight
  • Expenditure
  • Financial appropriation
  • Government grants
  • Local taxation
  • Operational costs
  • Capital investment
  • Public safety
  • Crime prevention
  • Community policing
  • Resource allocation
  • Year-on-year comparison
  • Budgetary constraints
  • Fiscal year
  • Fund disbursement
  • Budget deficit/surplus
  • Trend analysis
  • Financial sustainability
  • Law enforcement funding
What to do next:
Look at other essays: