
The line graph illustrates information about the number of
books
borrowed from particular village libraries in different months and the pie chart highlights information about how many types of Use synonyms
books
Use synonyms
borrowed
.
Add a missing verb
were borrowed
Overall
, it can be clearly seen that the different Linking Words
books
borrowed including West Eaton, Sutton Wood and Church Mount increased, and Fiction had the highest percentage among these Use synonyms
books
in 4 months.
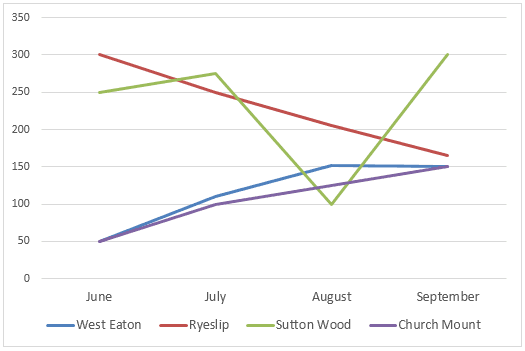
Looking at the details, as regards the line graph, The book of Sutton Wood borrowed as 250 in June and fluctuated. It Use synonyms
then
reached a peak of 300 in September 2014. Linking Words
While
Ryeslip borrowed with 300 in June, Linking Words
then
decreased sharply to 175 in September.
As for the pie chart, Fiction was the highest borrowed at 43% over 4 months compared with Self-Help. The types of Linking Words
books
borrowed as History and Science have the same share of 14%, Use synonyms
while
Biography had 14% of all Linking Words
books
.Use synonyms